Search for answers or browse our knowledge base.


Configuration Watch tracks changes to the infrastructure components your applications depend on. Property files, individual files, and database configuration values are checked on a configurable schedule, with the option to compare snapshots across instances or across time.
An OS patch upgrade, a tweaked config file, or a manual change in production can shift application behavior without any code change. Configuration Watch keeps a history of those changes so you can find what changed and roll it back.
Watch types
- Property Watch. Monitors property files (.prop, .conf). Captures every key-value change with the timestamp it was detected.
- File Watch. Monitors files in the system. Reports any file change with its file timestamp and detection time.
- Query Watch. Monitors configuration values stored in the database, captured by running queries against config tables.
Config Watch KPI
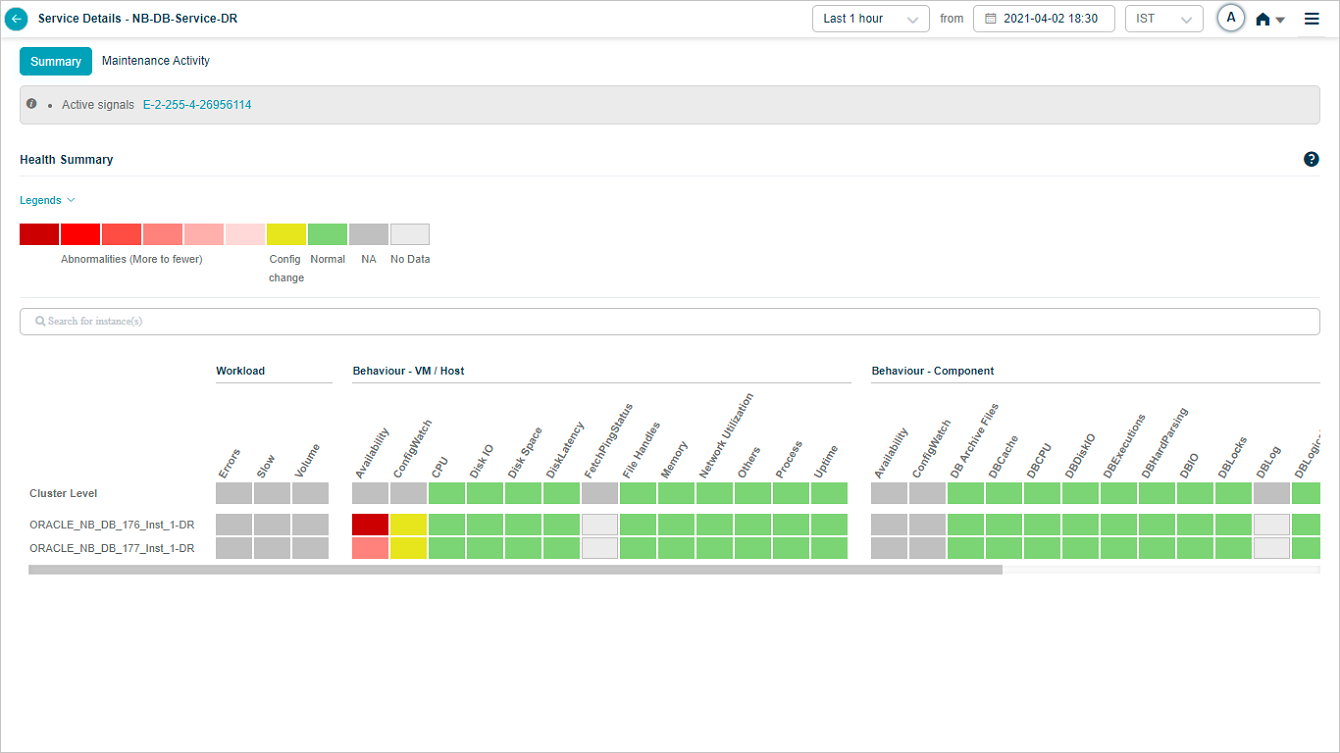
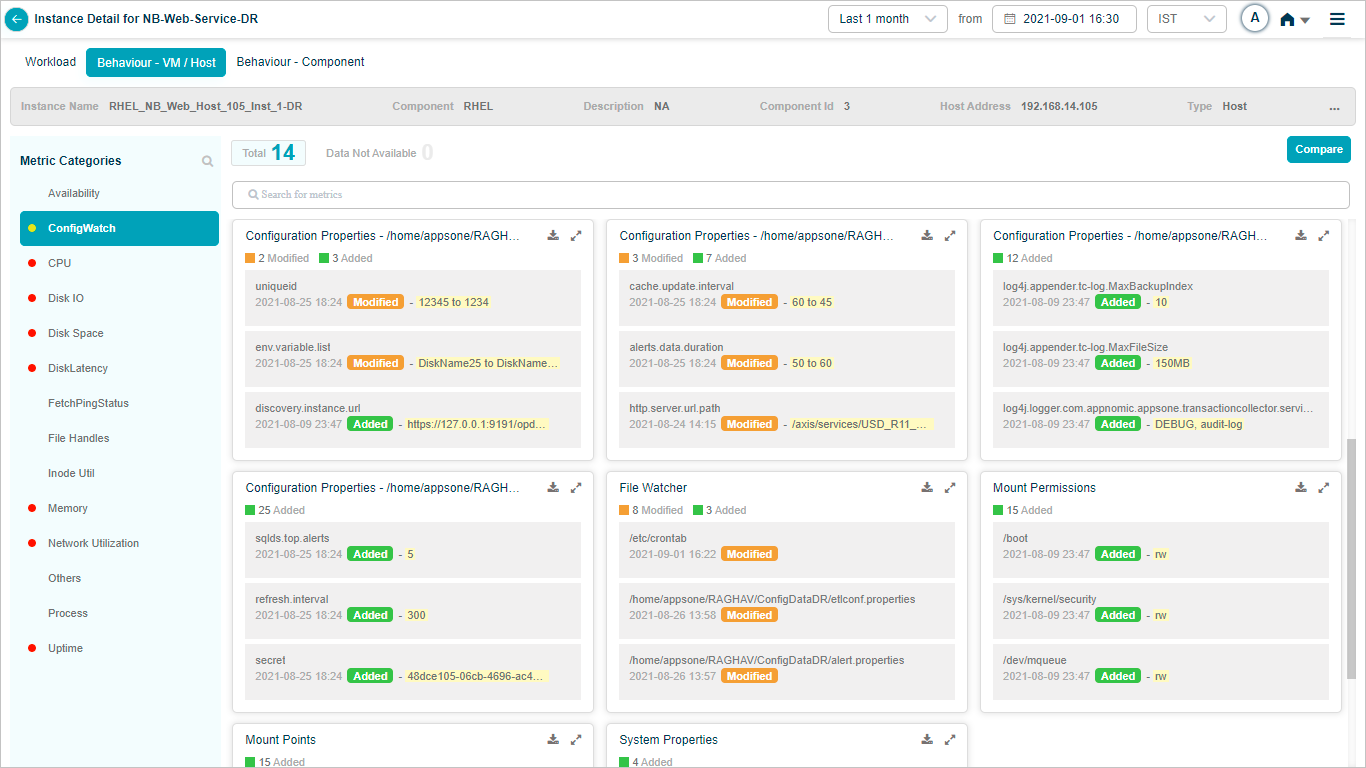
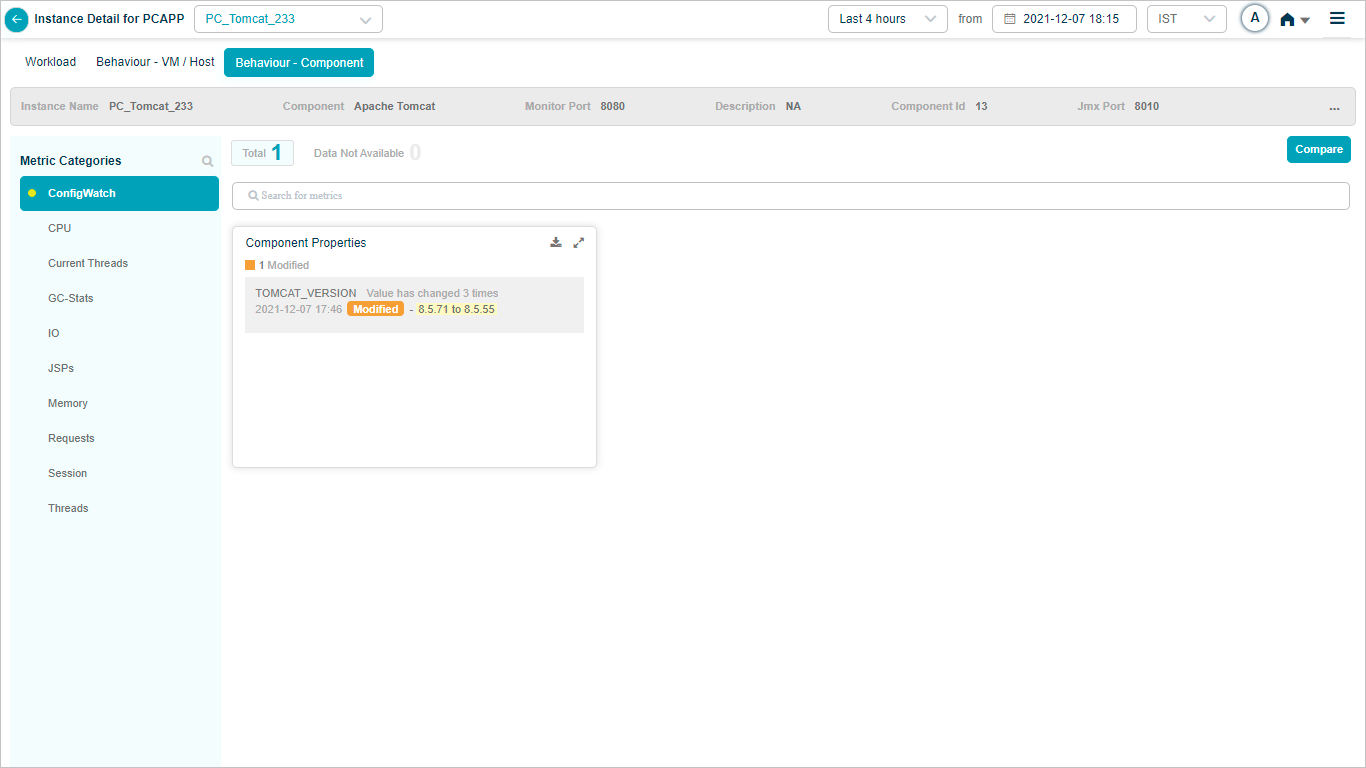
The Config Watch KPI is at the instance level. When a configuration changes, the corresponding block goes yellow. The color stays yellow regardless of how many changes happened in the selected period. Detection runs at the KPI collection interval, which you can adjust. Click any yellow block to see the changes.
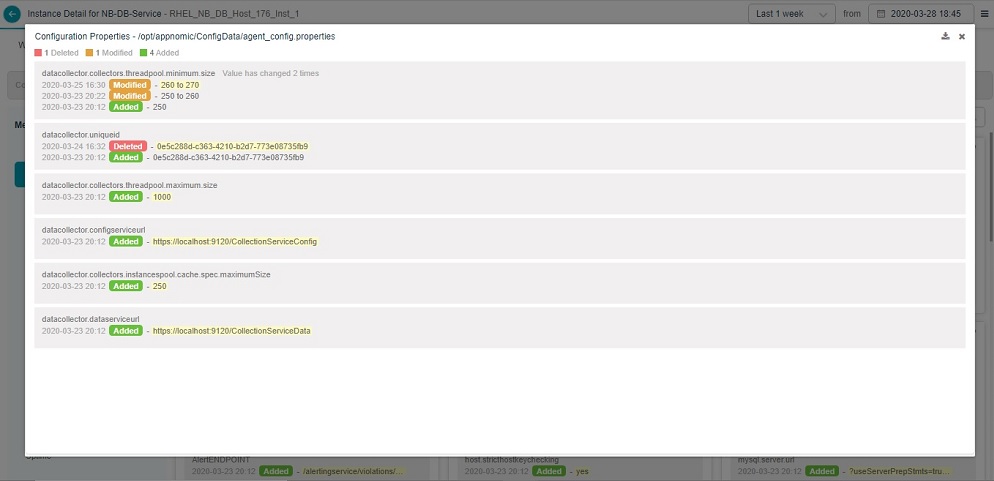
View configuration properties
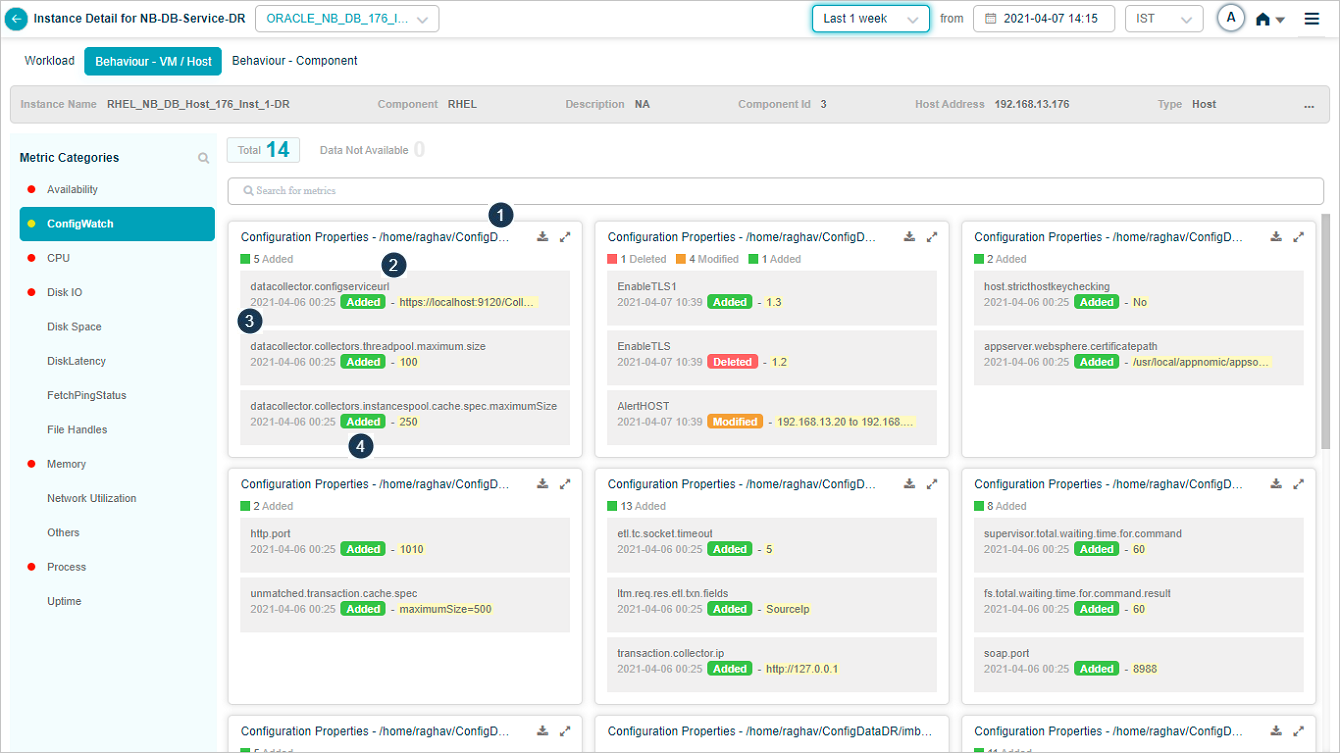
1. Property file. File containing key-value pairs.
2. Key name.
3. Timestamp. When the key was added, deleted, or modified.
4. Last action.
- Added. A new property was added.
- Deleted. A property was removed.
- Modified. A property’s value was updated.
The last action stays visible until the next change.
5. Current value. The property’s current value.
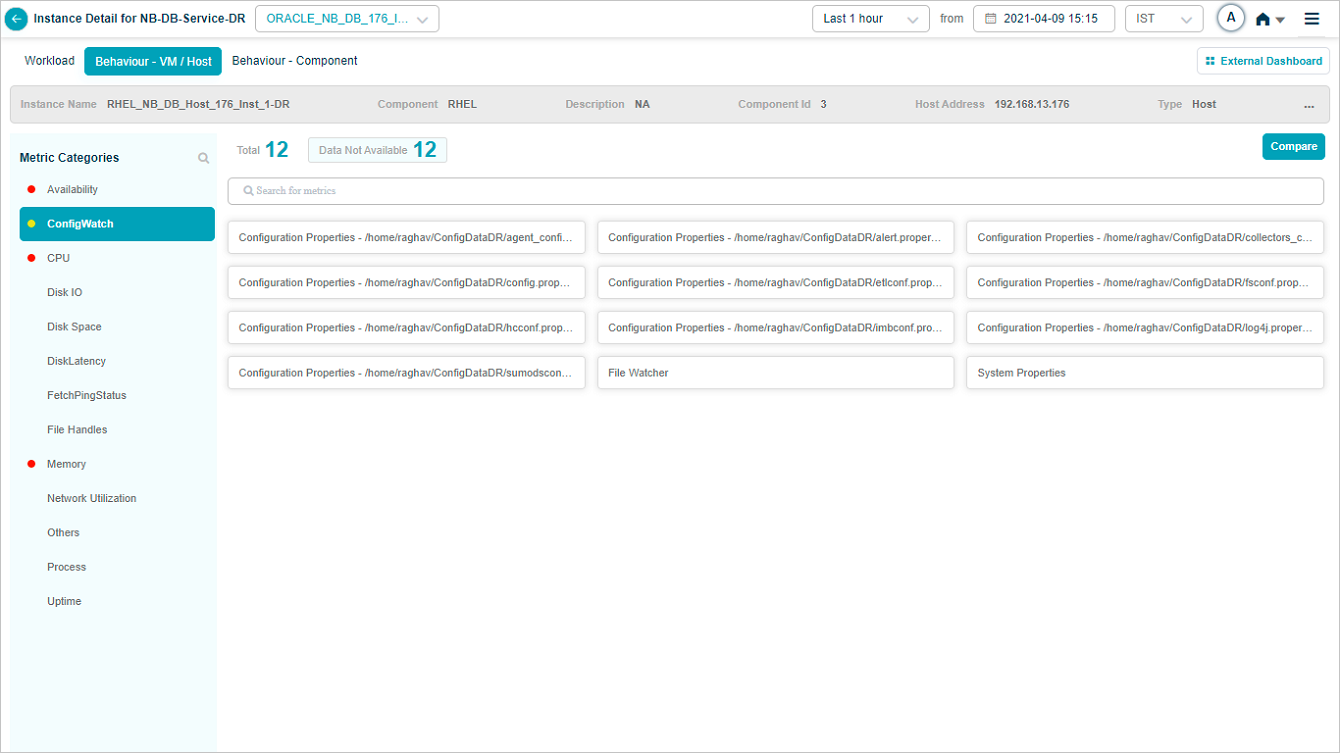
Click Data Not Available to see metric pods with no data.
Search a metric
Click the Search for metrics box and pick the metrics you want.
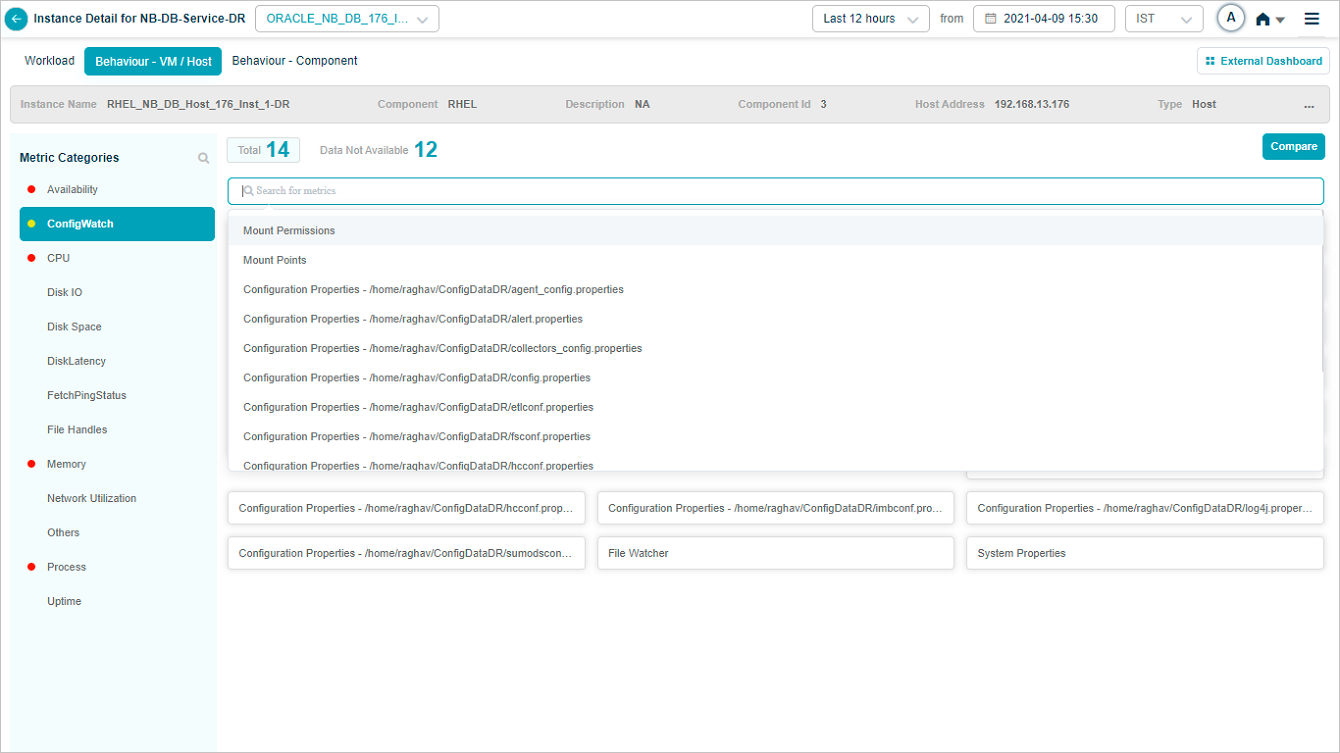
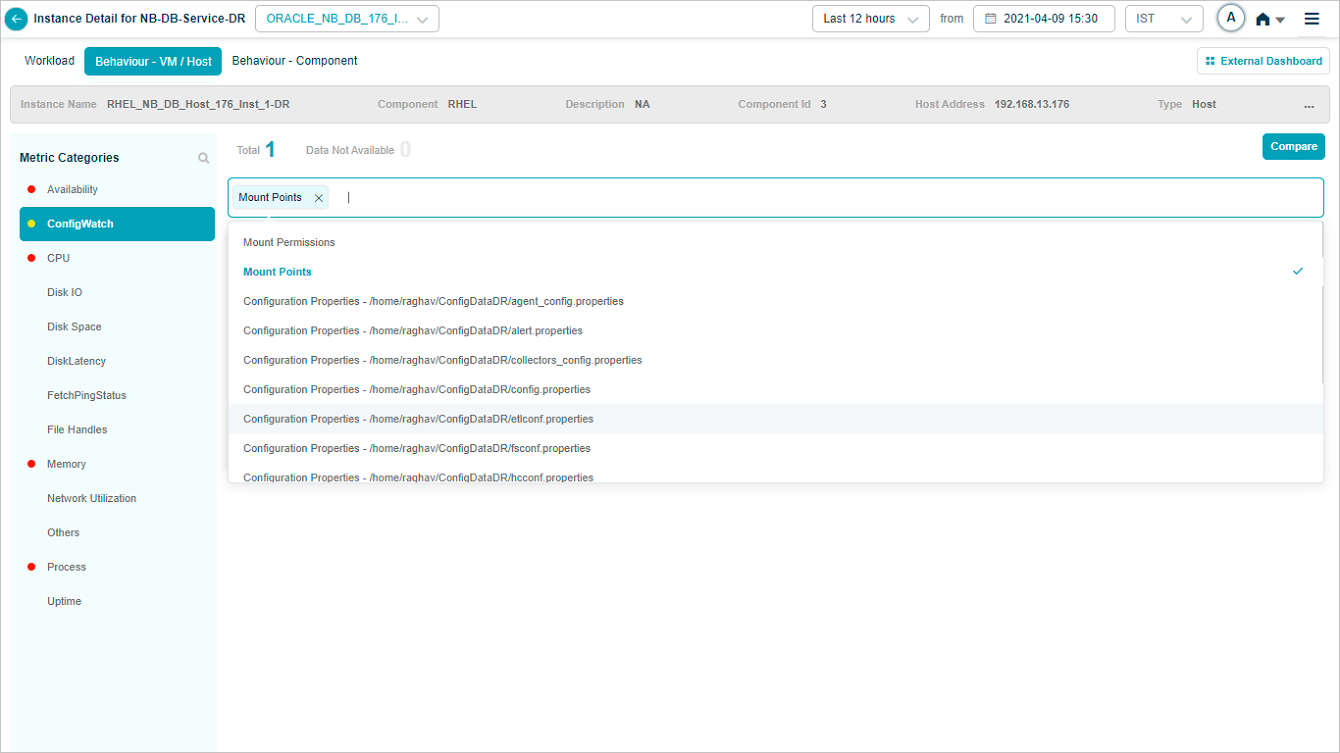
Only the selected metric pods stay on screen.
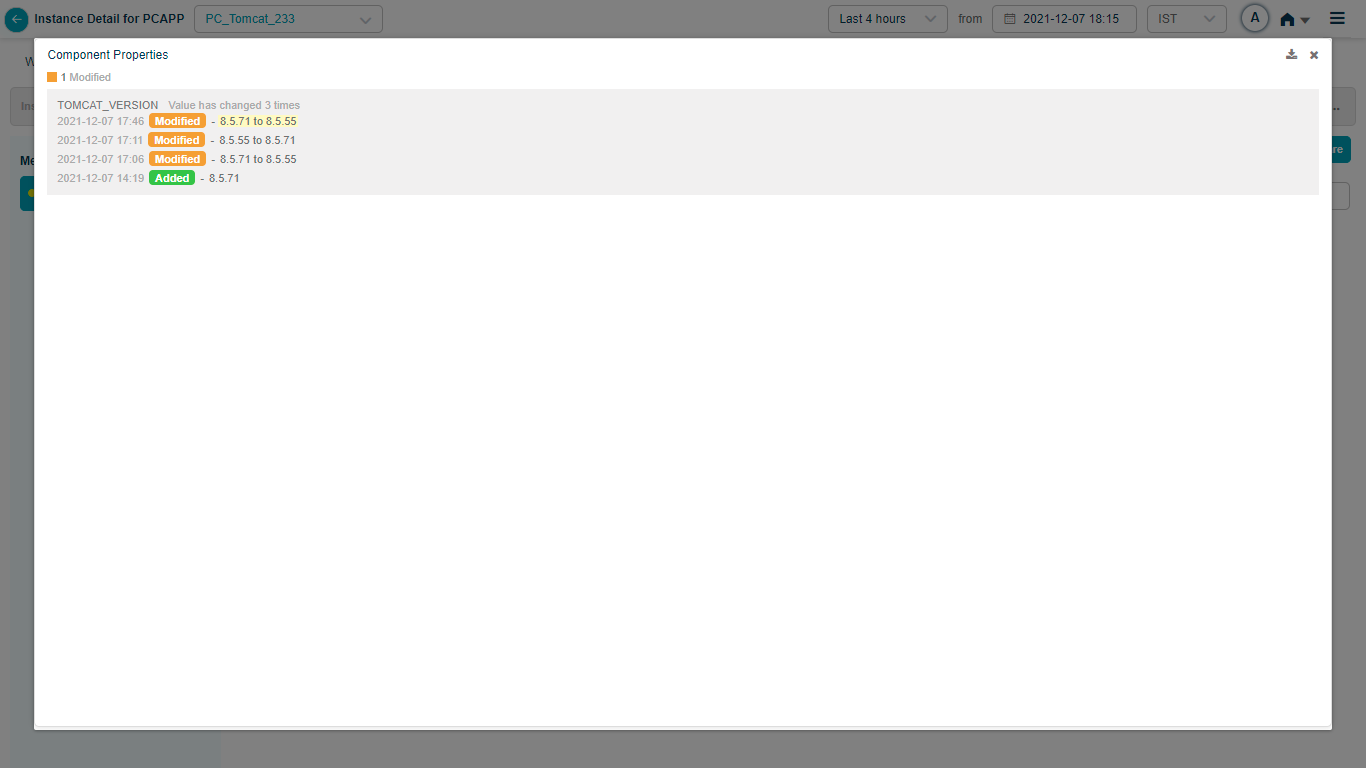
Expand a pod
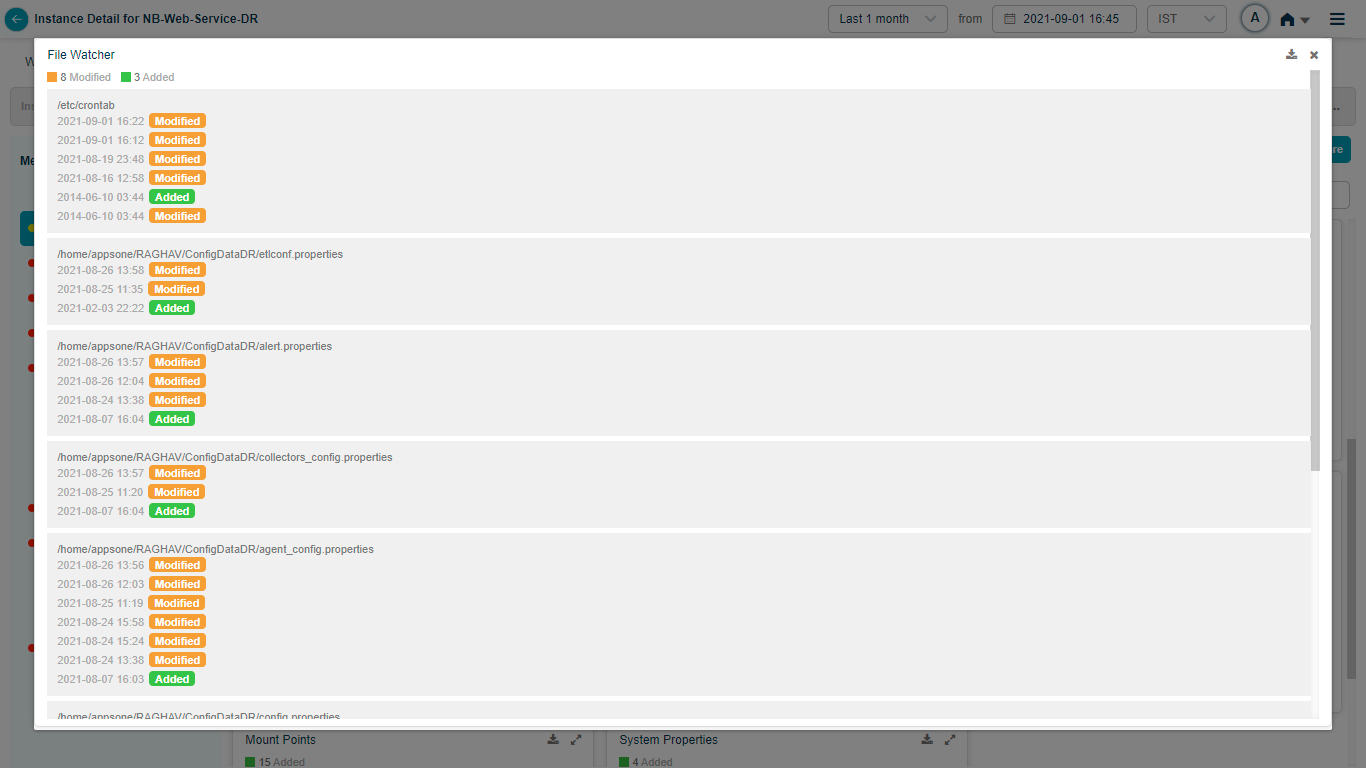
Click the expand icon in the top-right of any pod to see the change history. The header shows a summary of changes for that file.
Download configuration changes
Click the download icon in the top-right of a pod to export the changes as CSV.
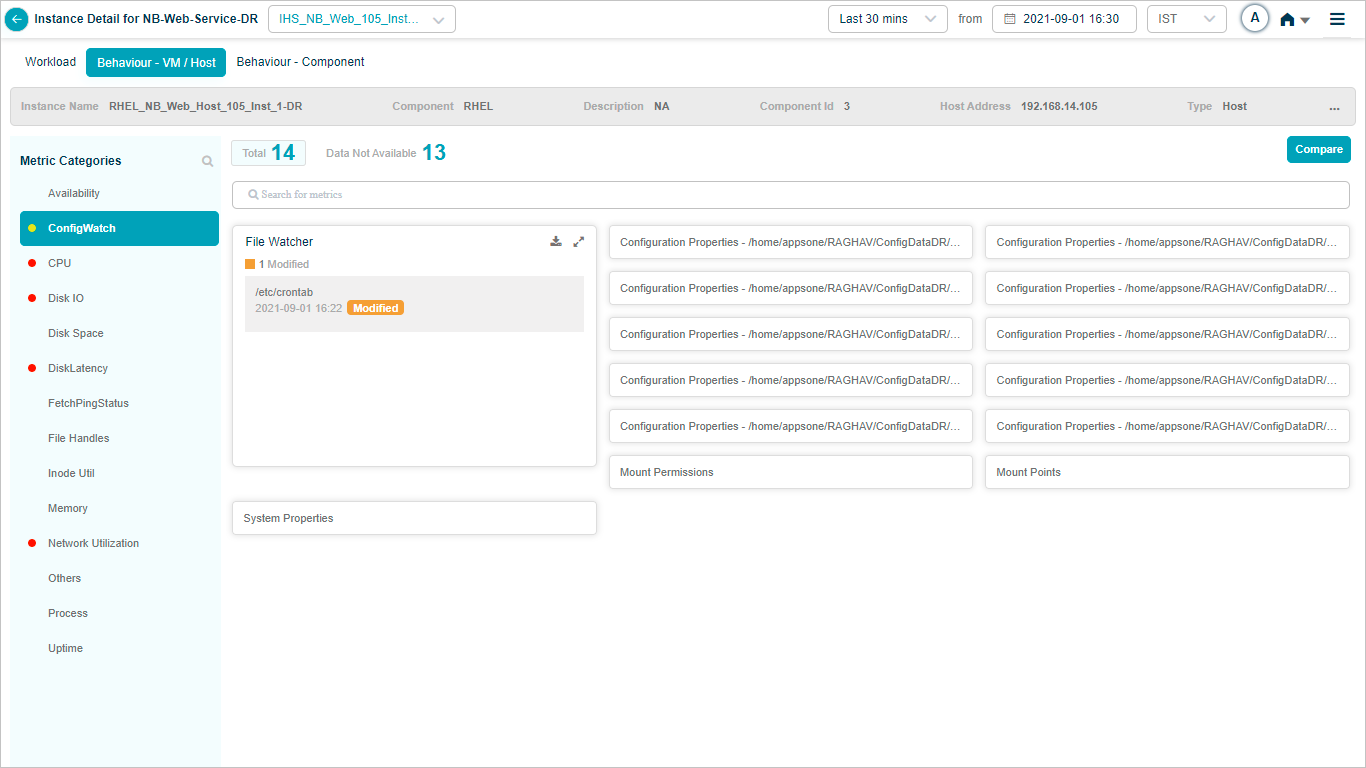
File Watcher
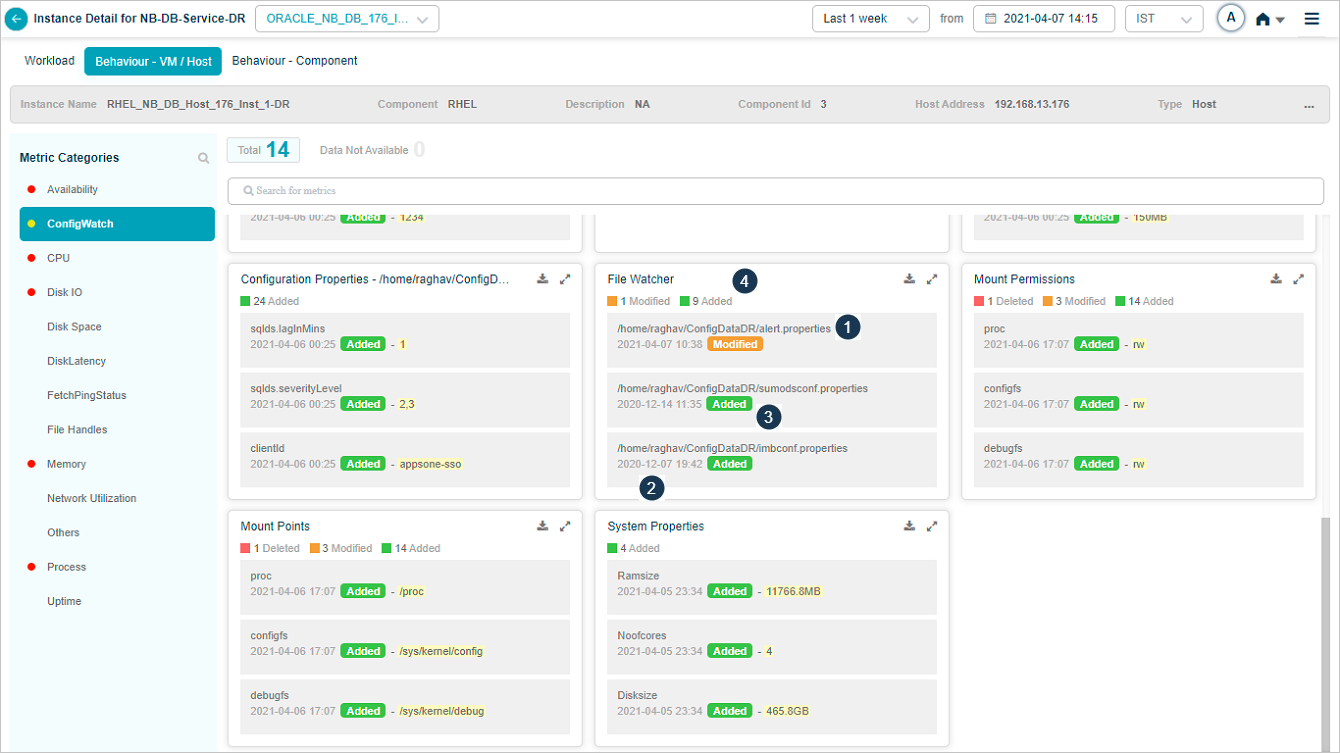
1. File name. The file being monitored.
2. Timestamp. When the file was added, deleted, or modified.
3. Last action. File added, deleted, or changed. Does not show the exact diff. The last status stays visible until the next change.
4. Tile header. Summary of configuration changes.
Click the expand icon to see the file’s history.

Query Watcher
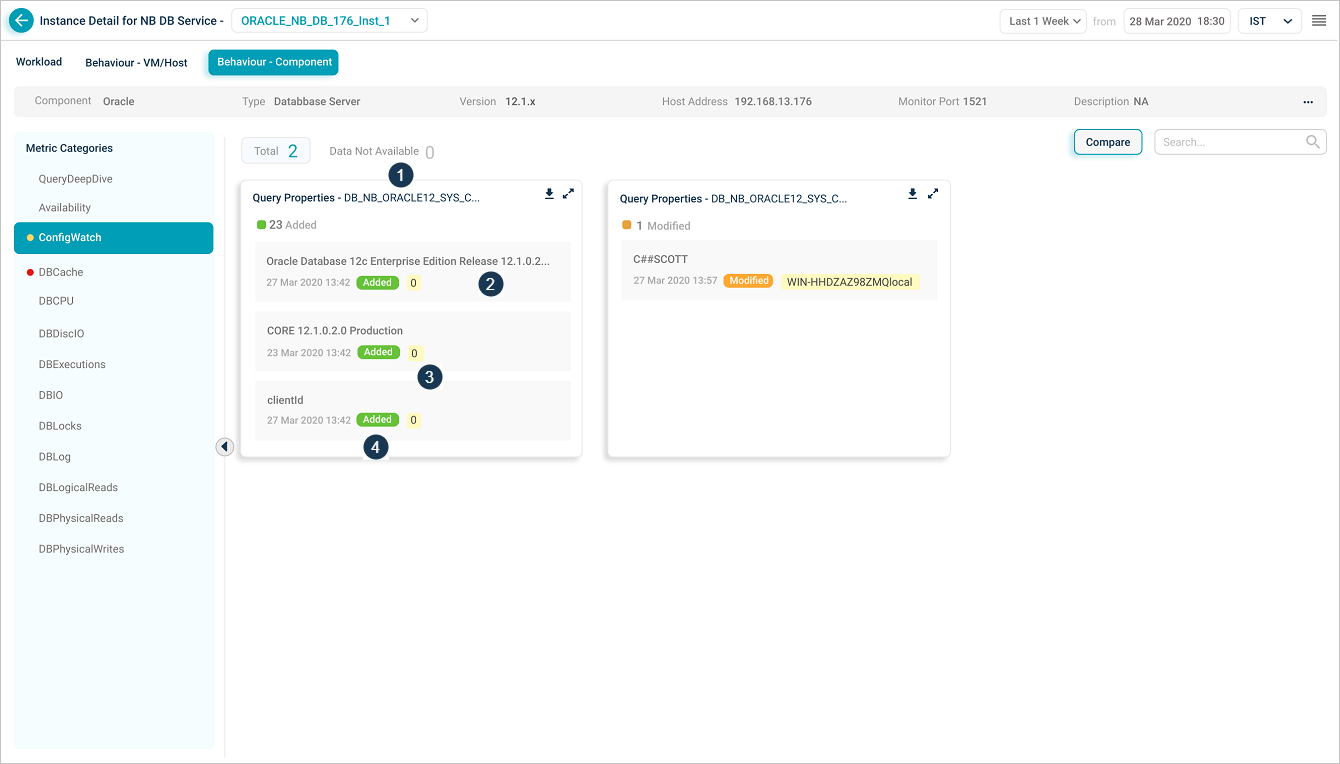
1. Query name. The query that runs in Oracle DB.
2. Database property name.
3. Database property value.
4. Last action.
- Added. A property was added.
- Deleted. A property was removed.
- Modified. A property’s value was changed.
Click the expand icon to see the query’s history.

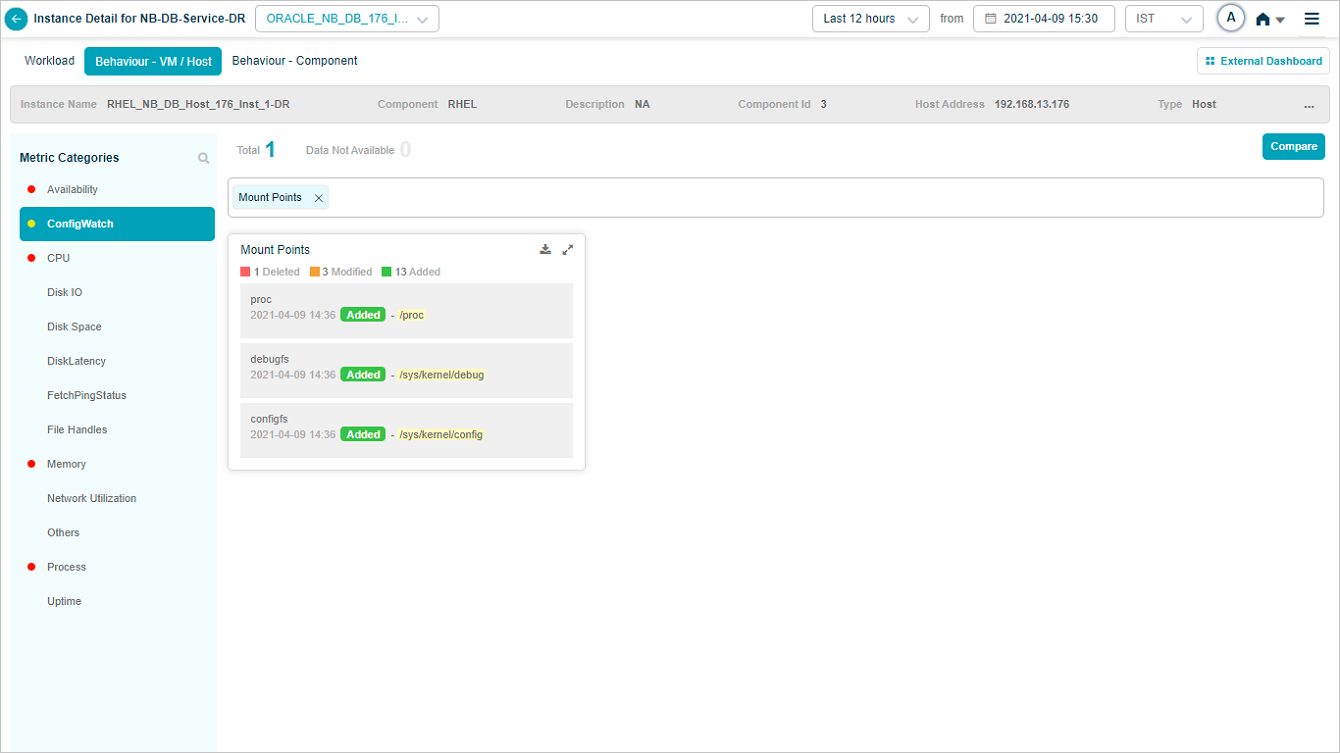
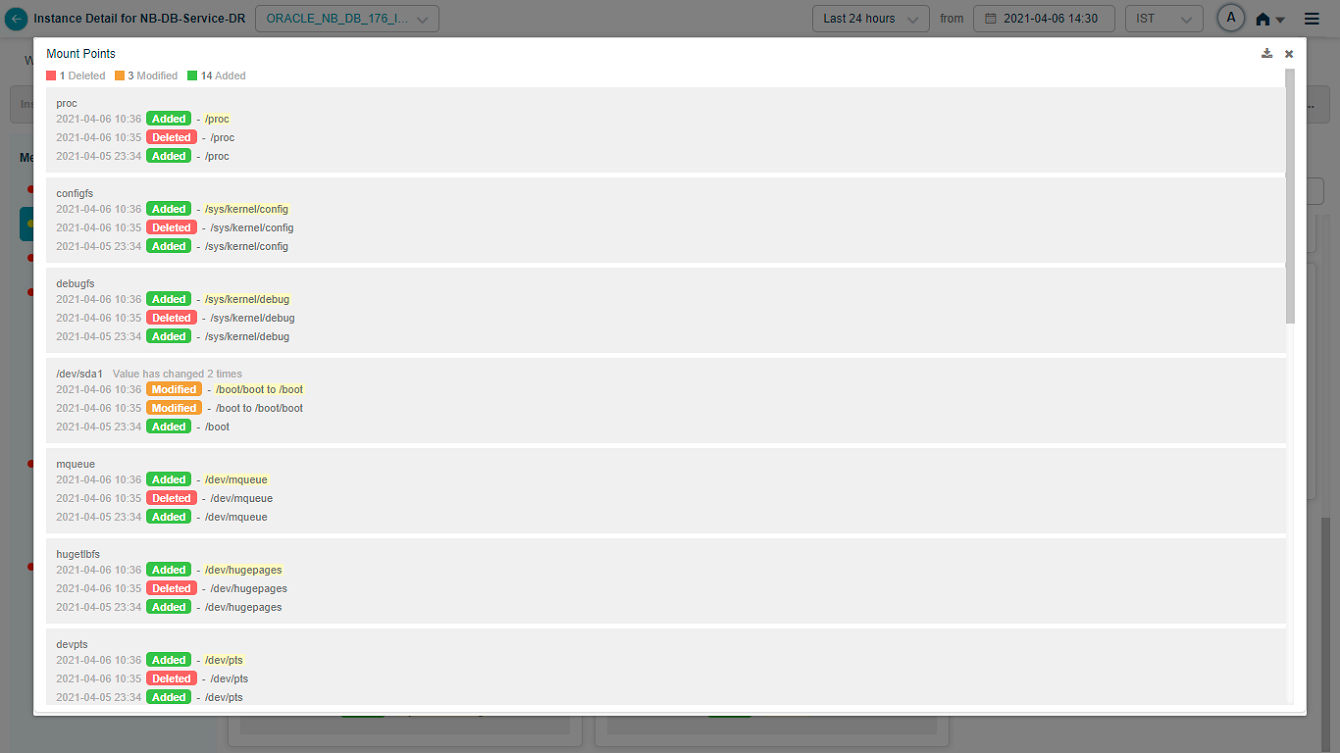
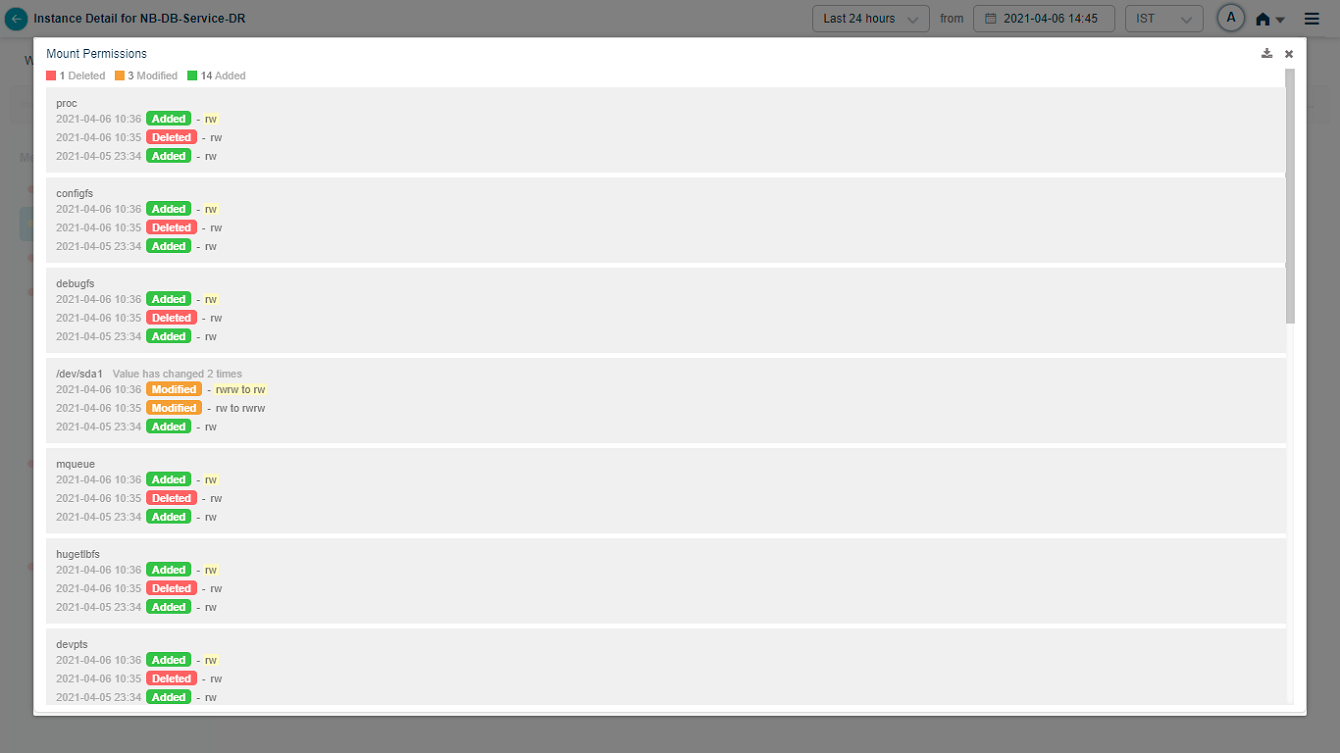
Mount permissions, mount points, system properties


Crontab
File Watch monitors /etc/crontab.
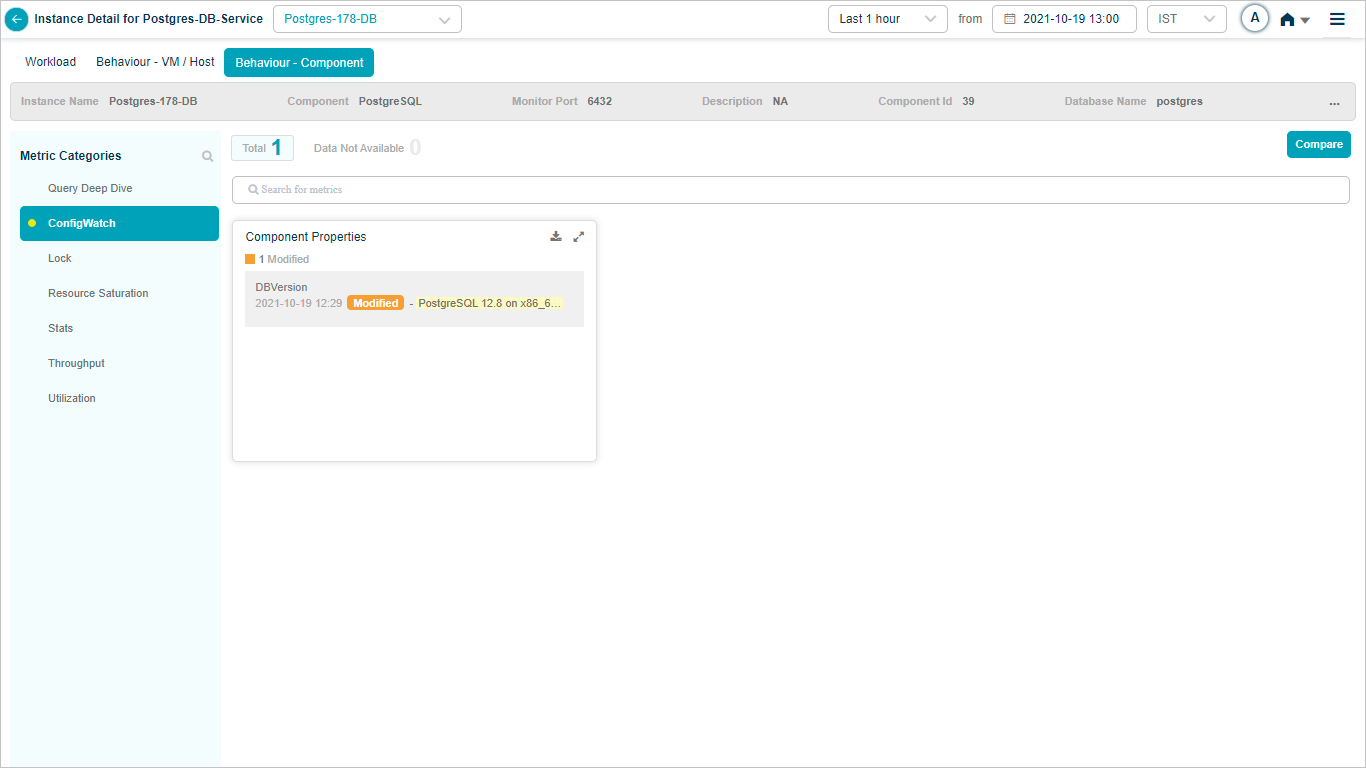
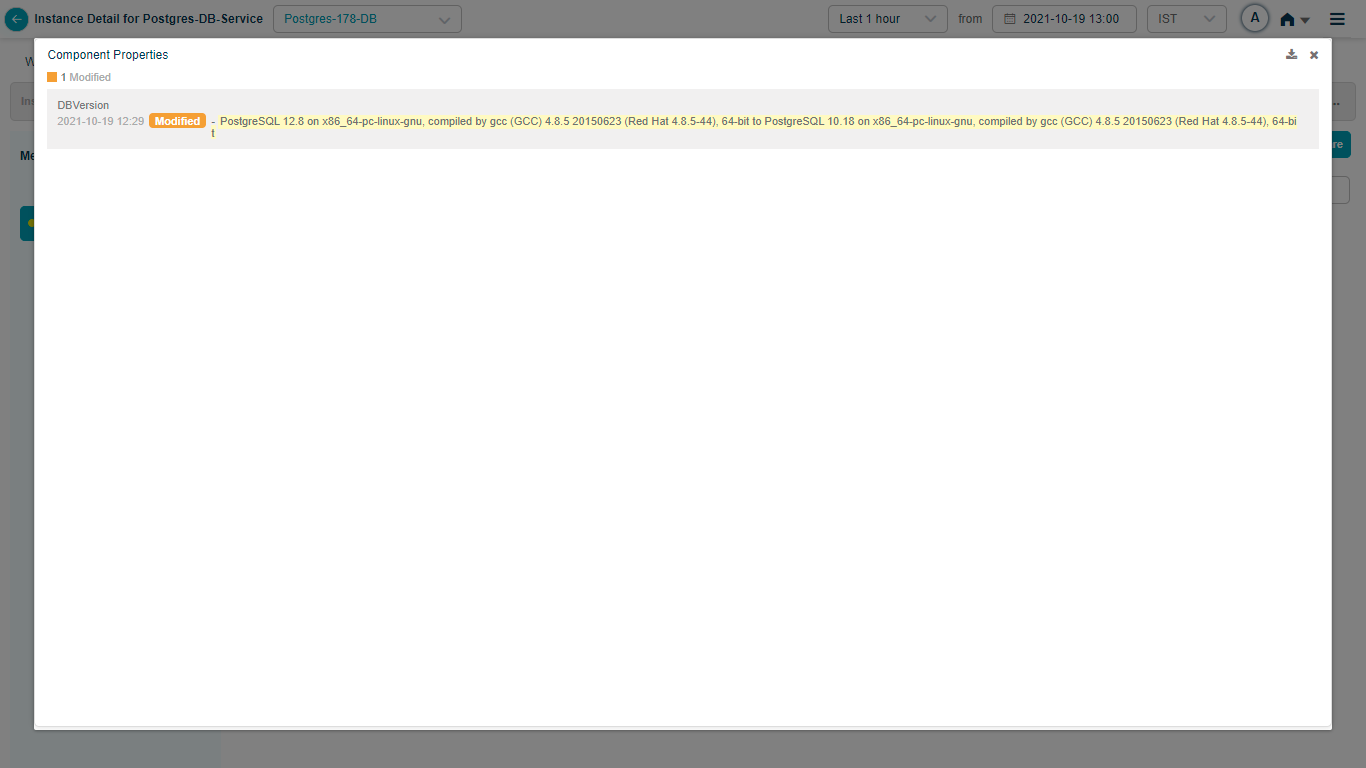
Component Properties
Component Properties tracks the version of database components. When a version changes, you see the old and new versions side by side. Adding an Application or Web component shows the version, and upgrading it updates the value.
Compare config changes
Click Compare to compare configurations.
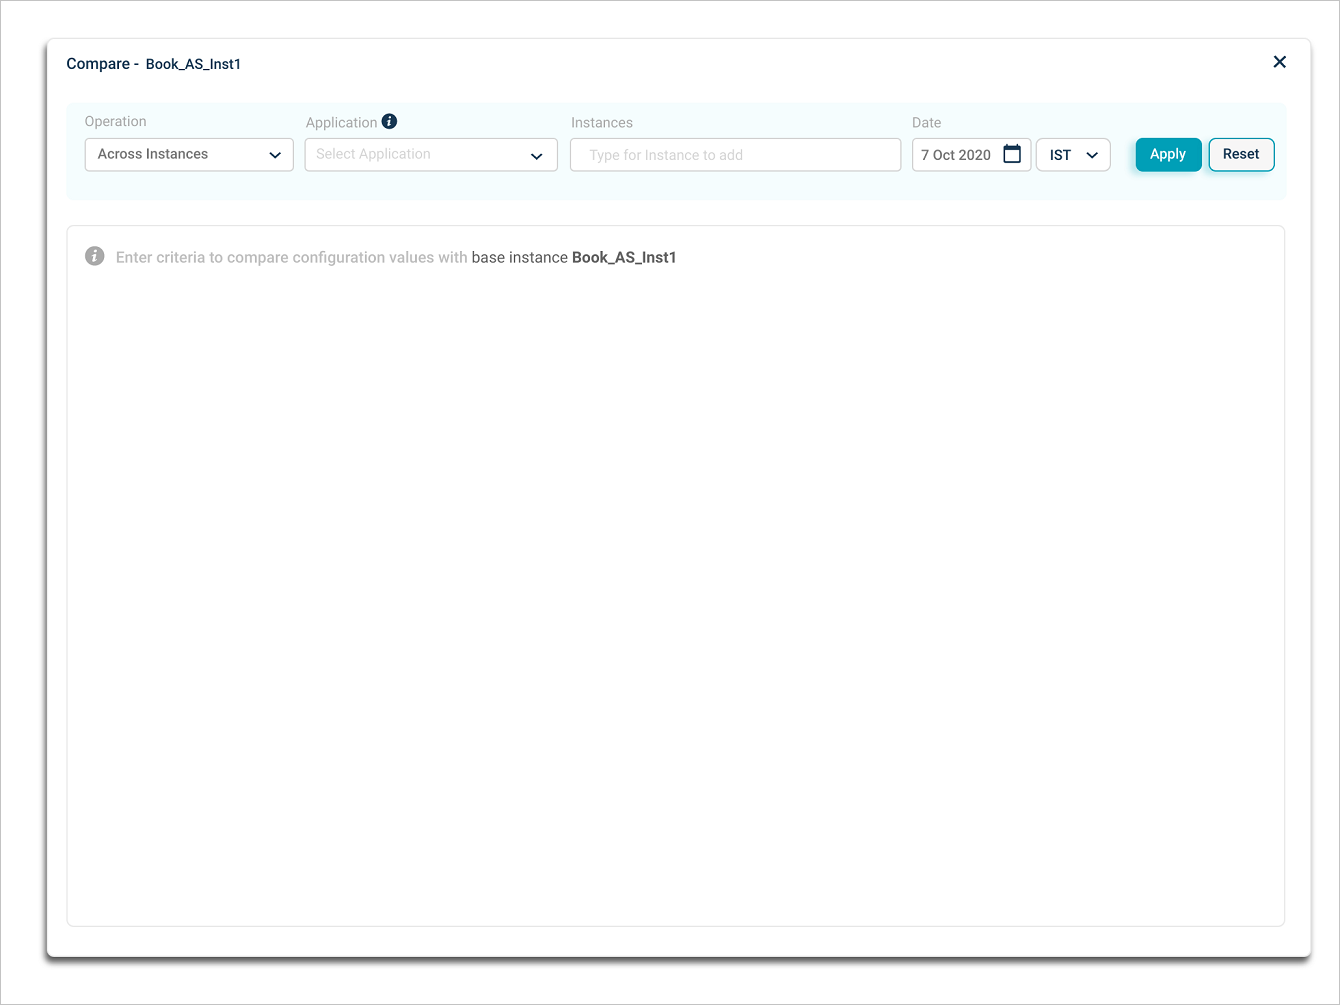
Click the Operation box to see the available comparison modes.

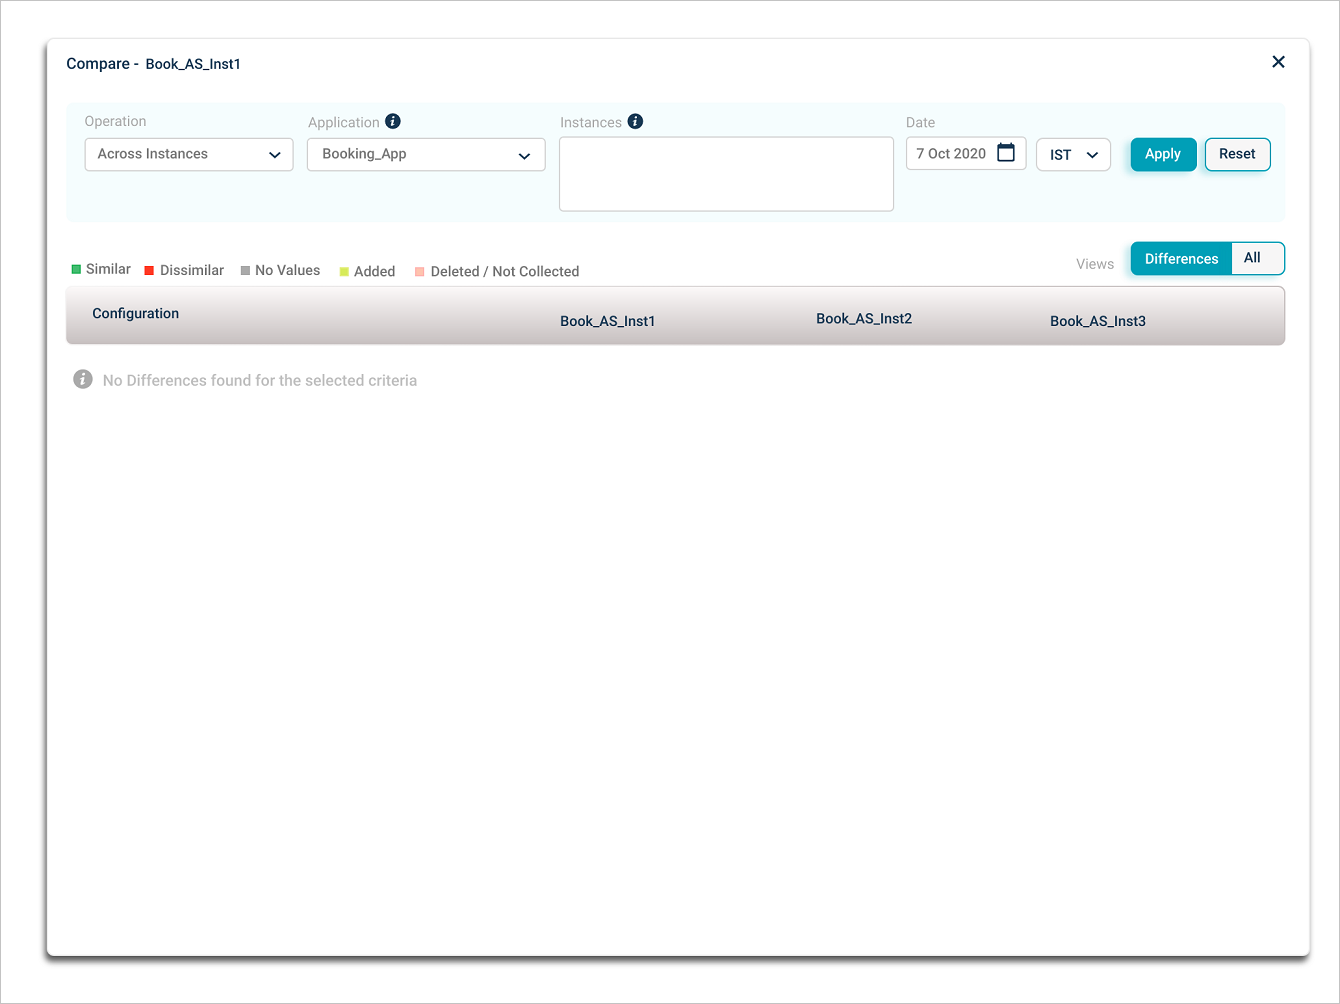
Compare across instances
Compare a host or component instance with up to three other instances of the same or different applications. HEAL compares the base instance with the others.
Pick Across Instances from Operation.
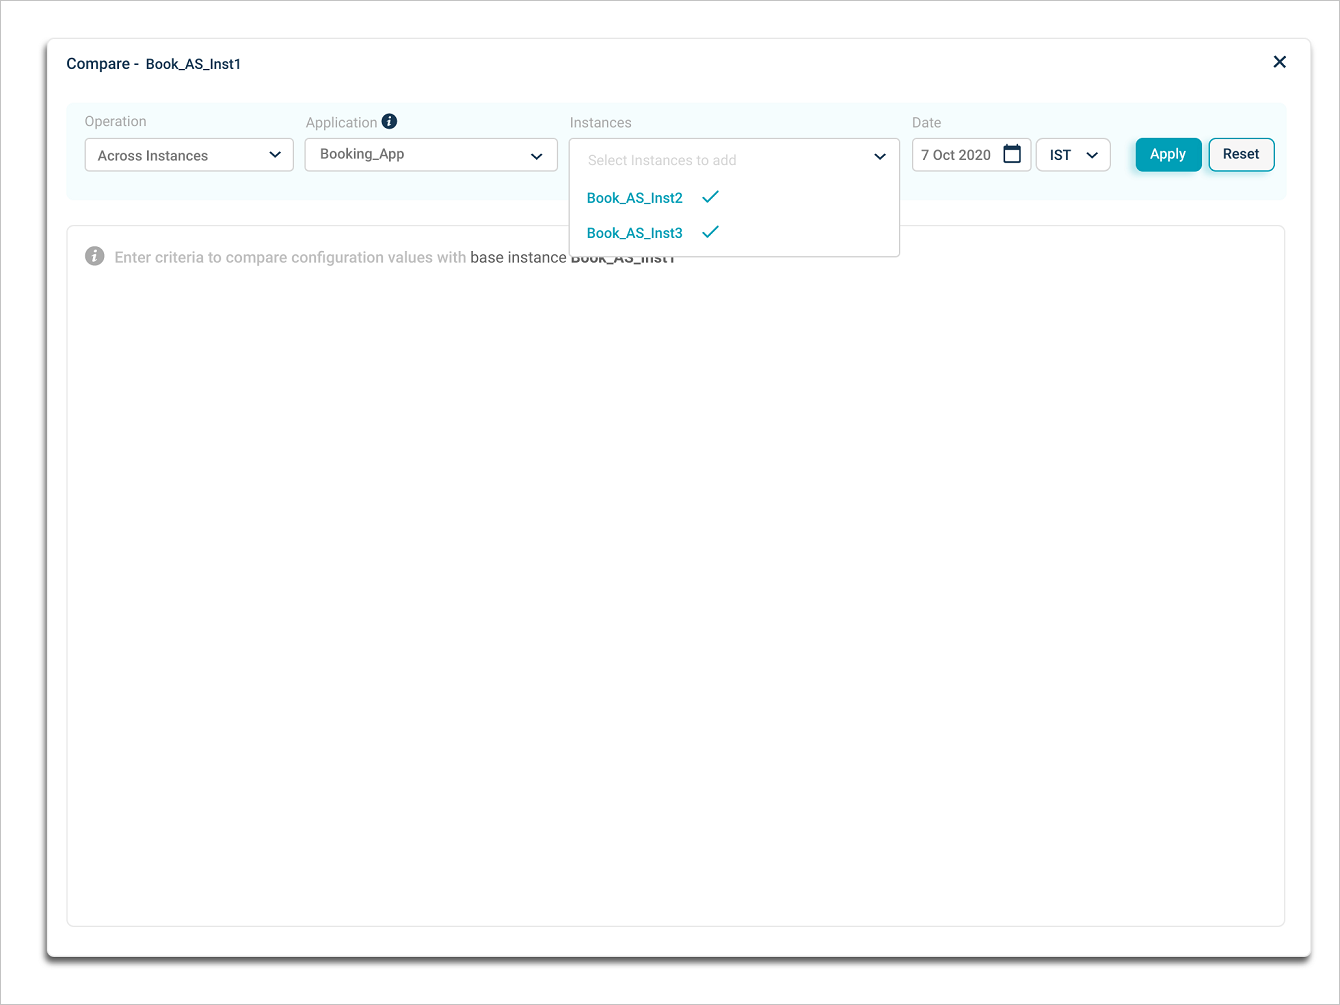
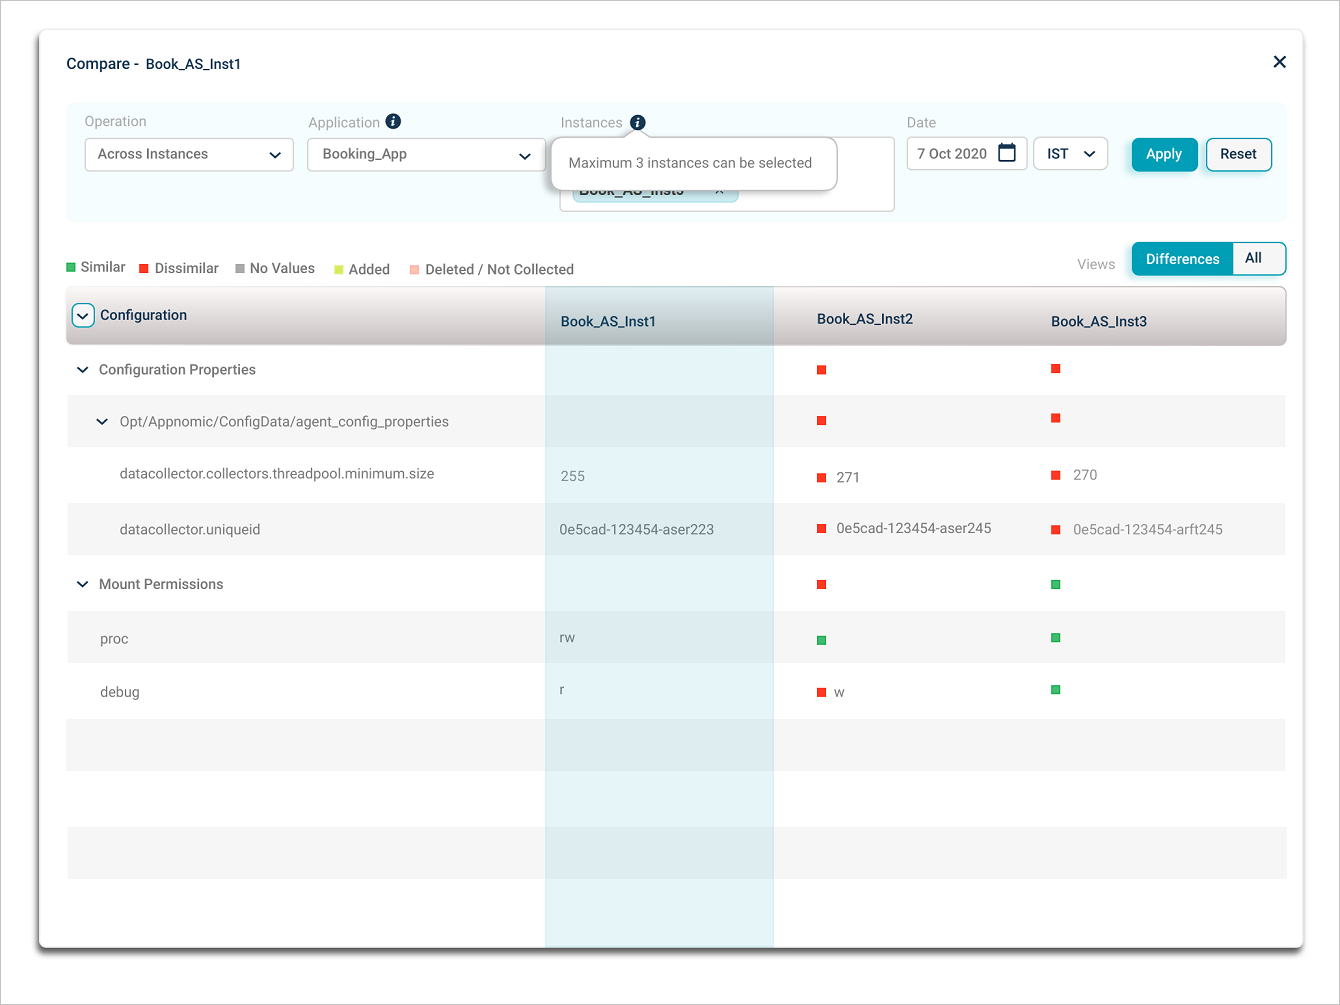
You can pick up to three instances.
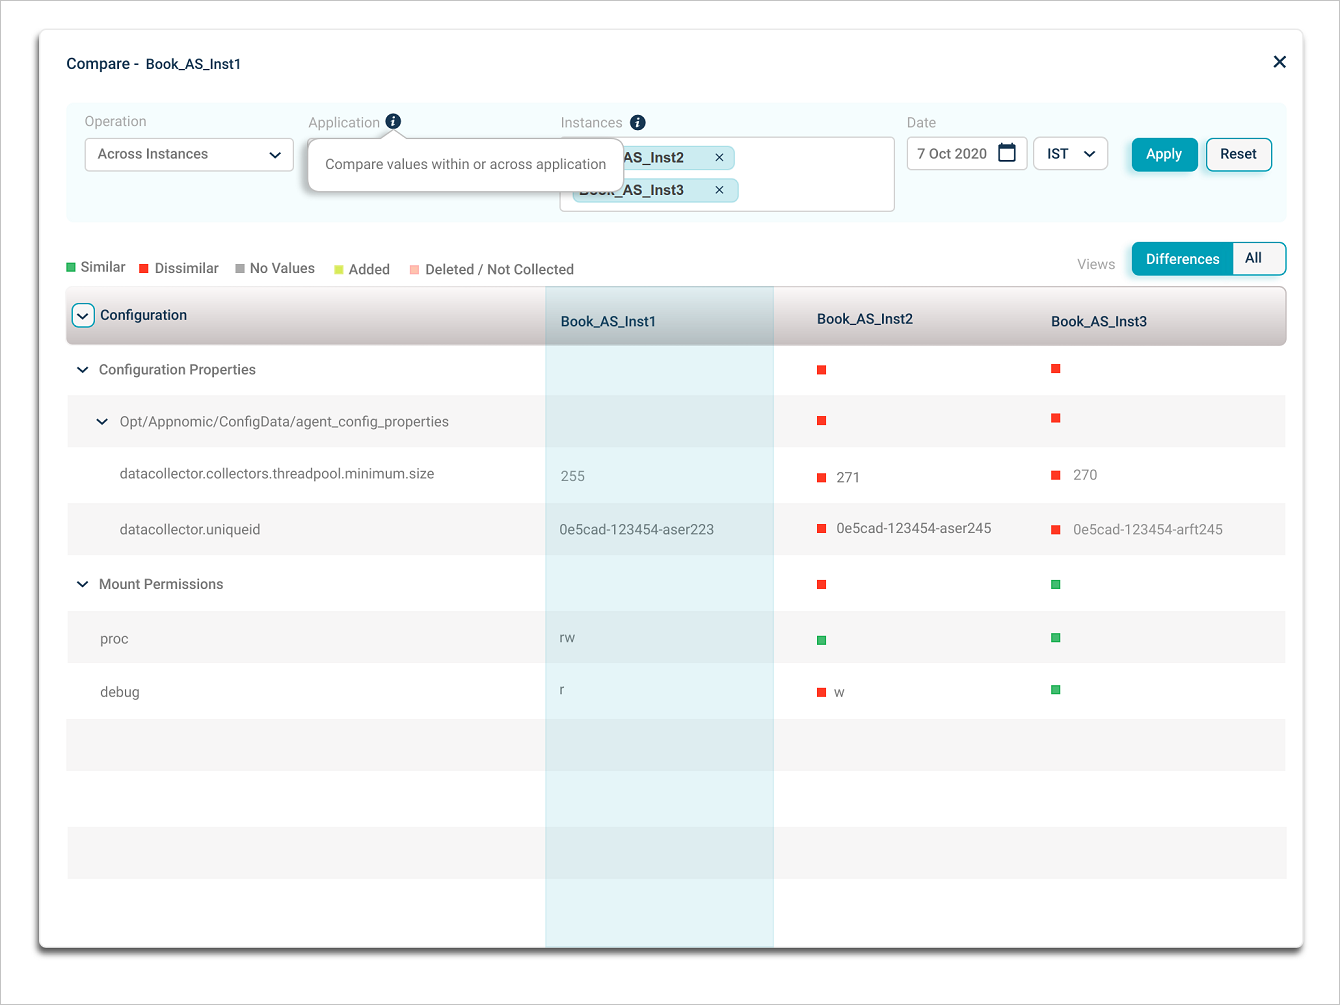
Pick the Application, then the Instances to compare against the base instance.
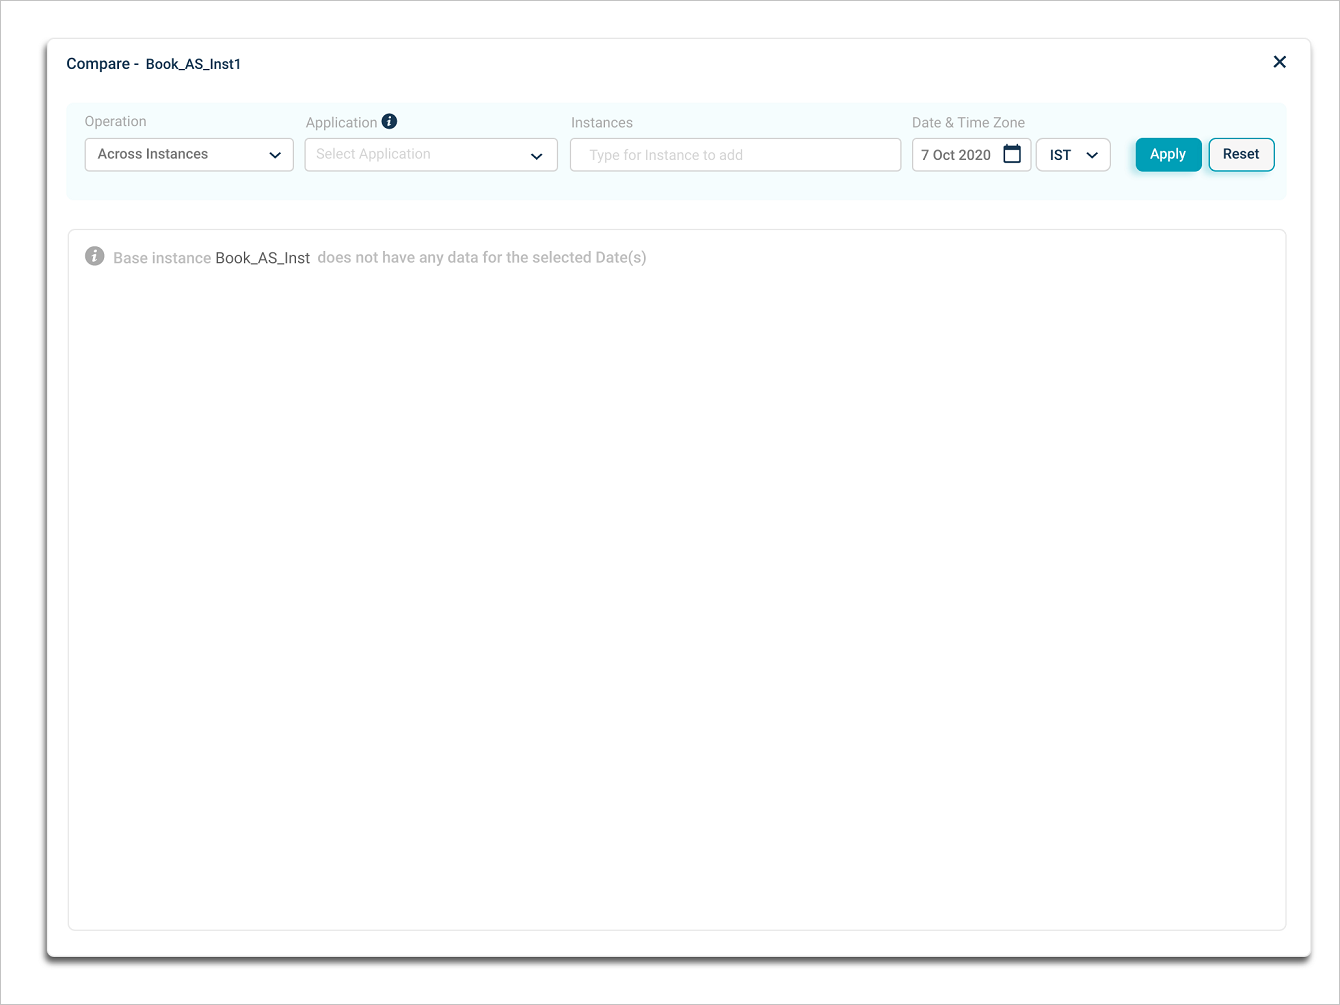
Pick a date and time zone, then click Apply. If the base instance has no data for the selected date, you see this view.
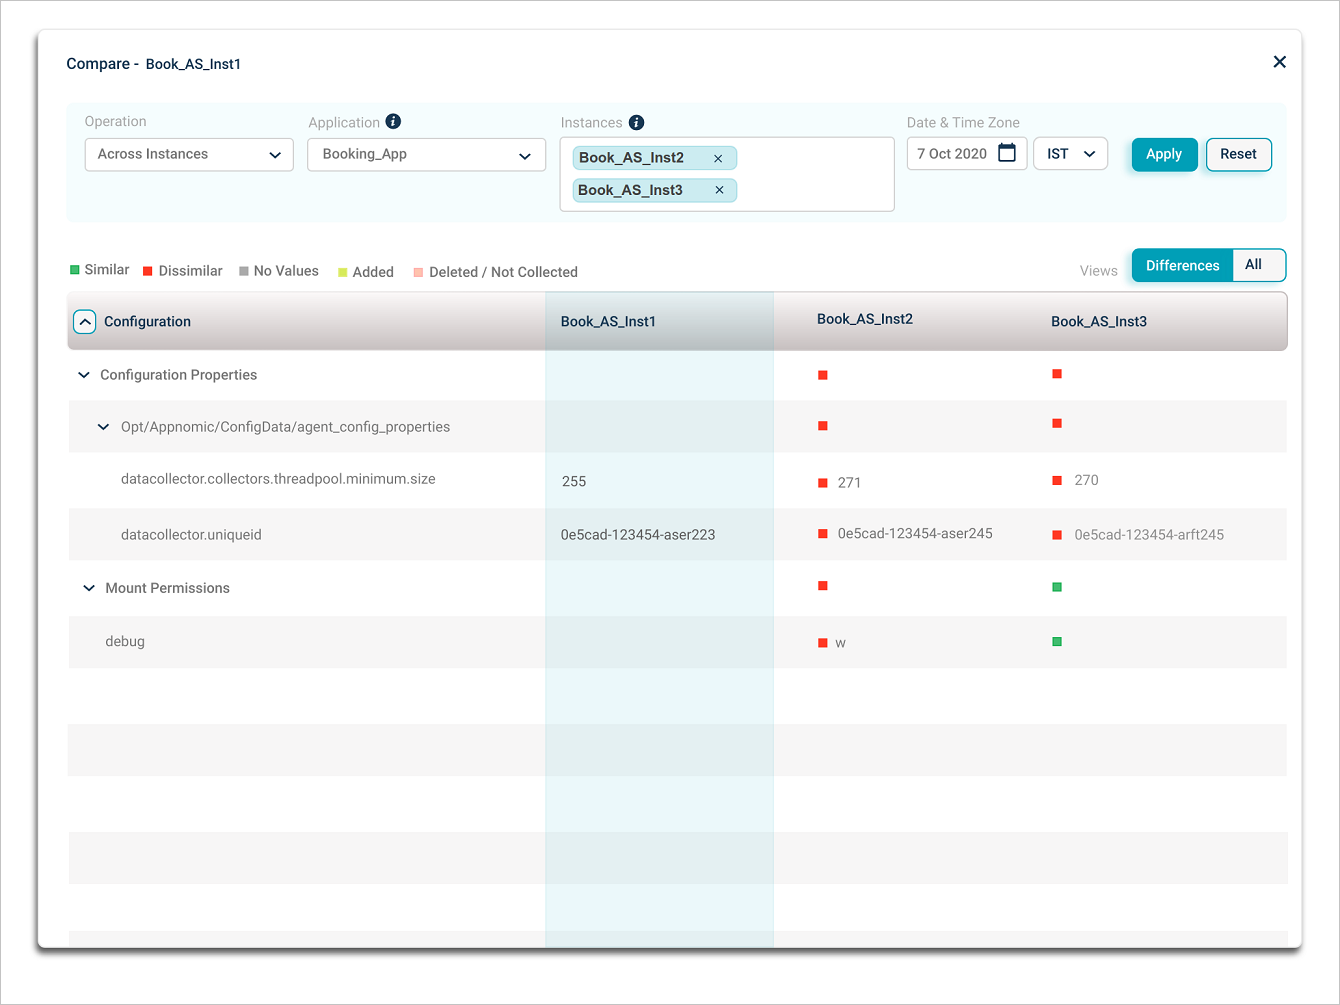
If the base instance has data, the comparison results appear.
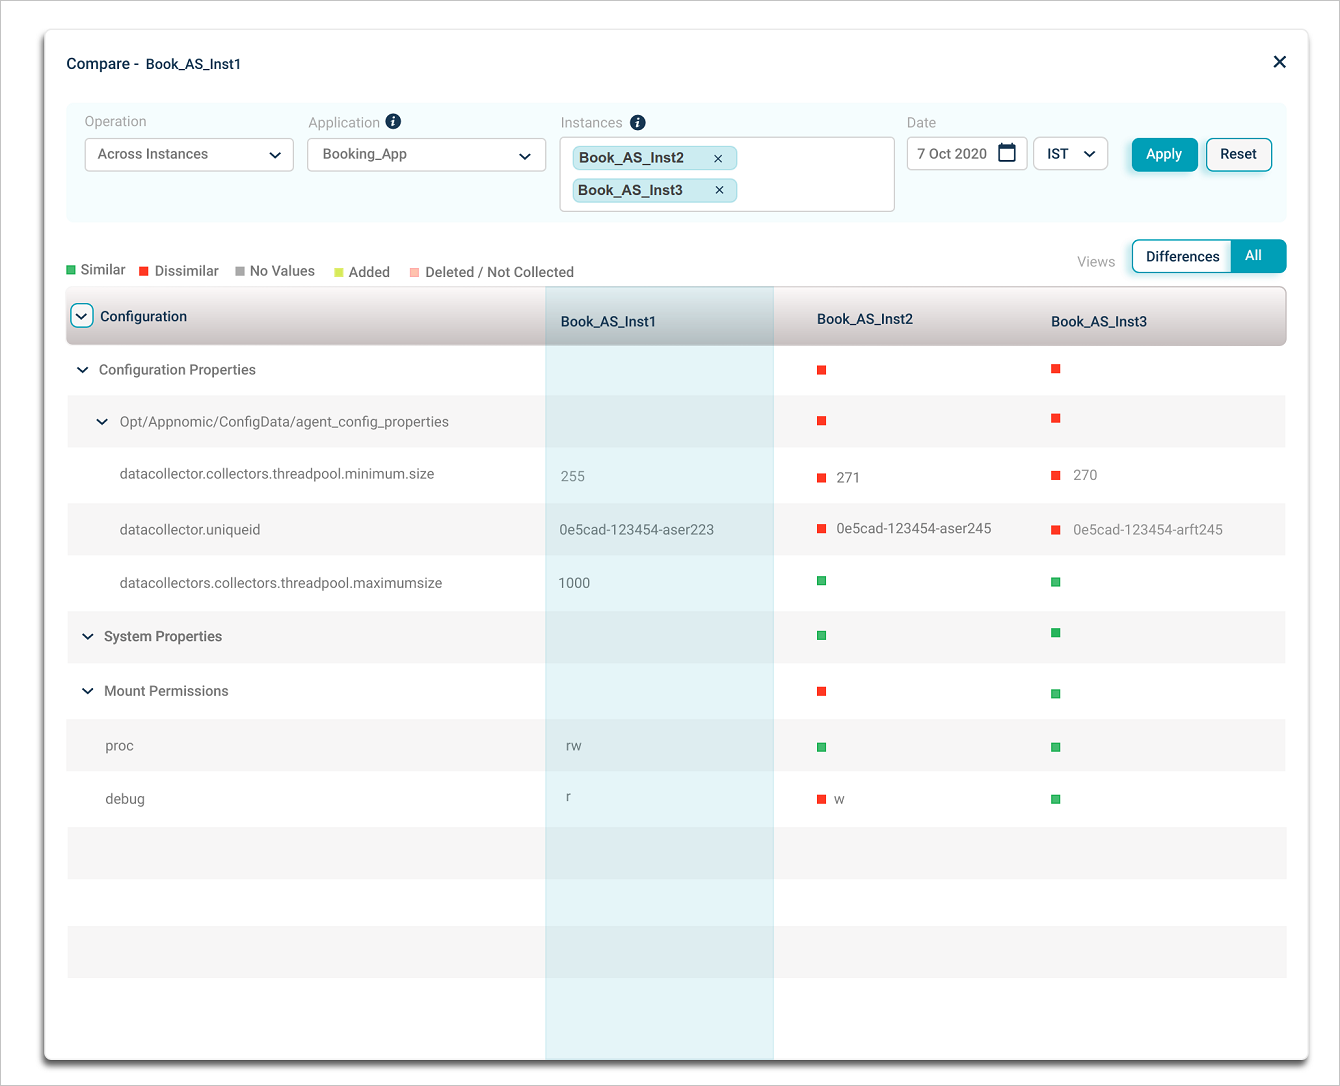
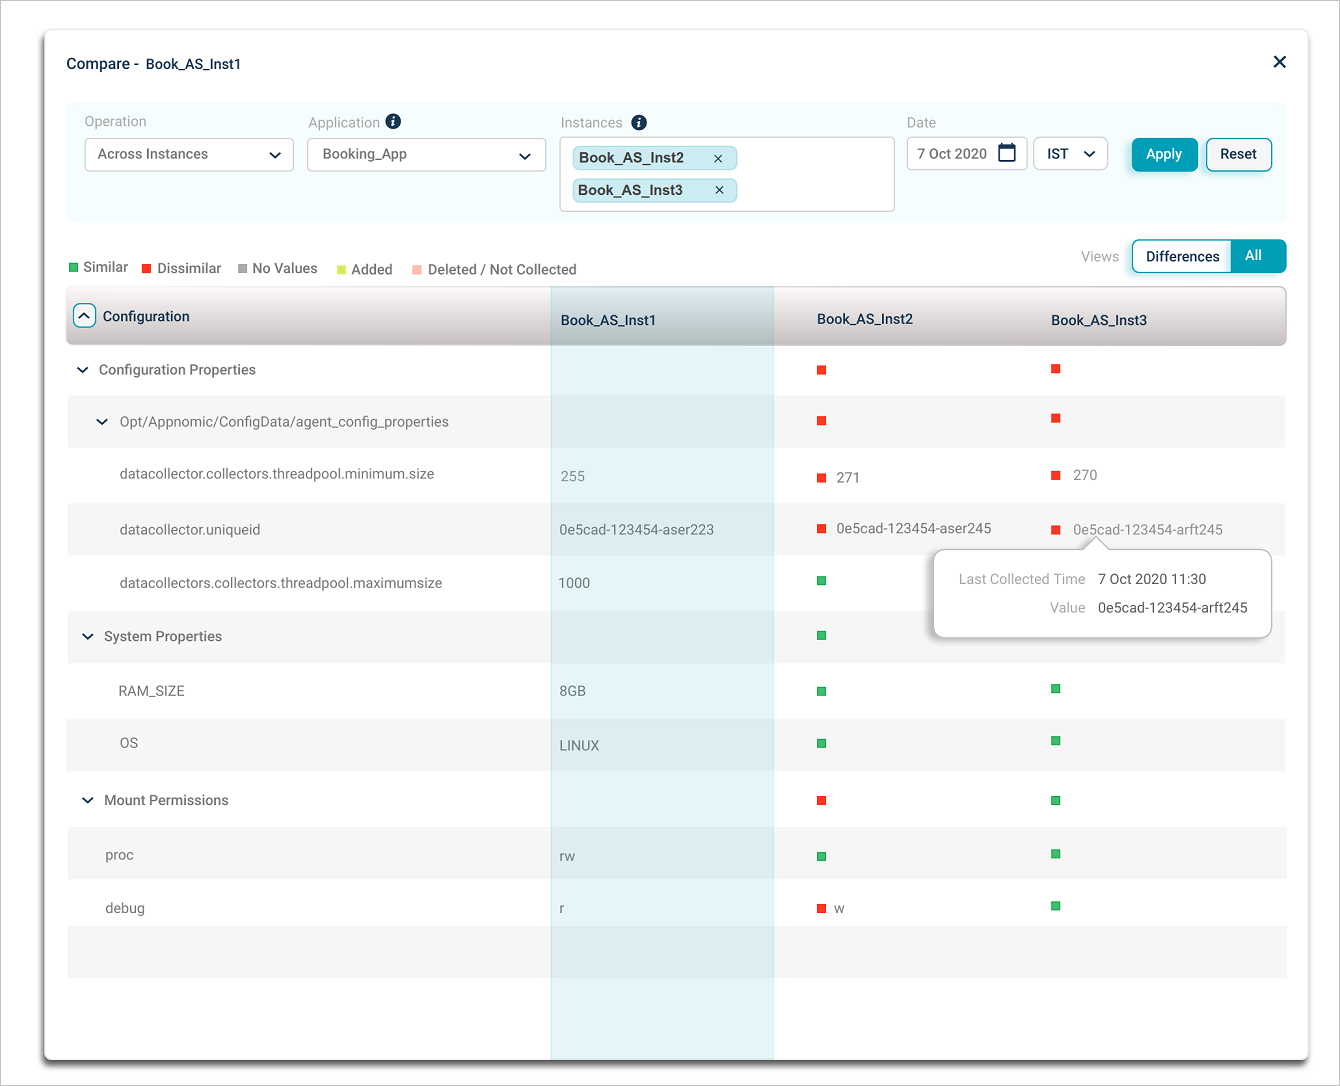
Use the expand or collapse icons to expand or collapse all configuration properties. Hover any value for the timestamp the agent last collected the KPI.
Config Watch KPIs are listed in the Configuration column. The comparison result for each KPI is one of:
- Similar. Base instance KPI value matches the selected instance.
- Dissimilar. Values do not match.
- No Values. KPI is configured but has no value.
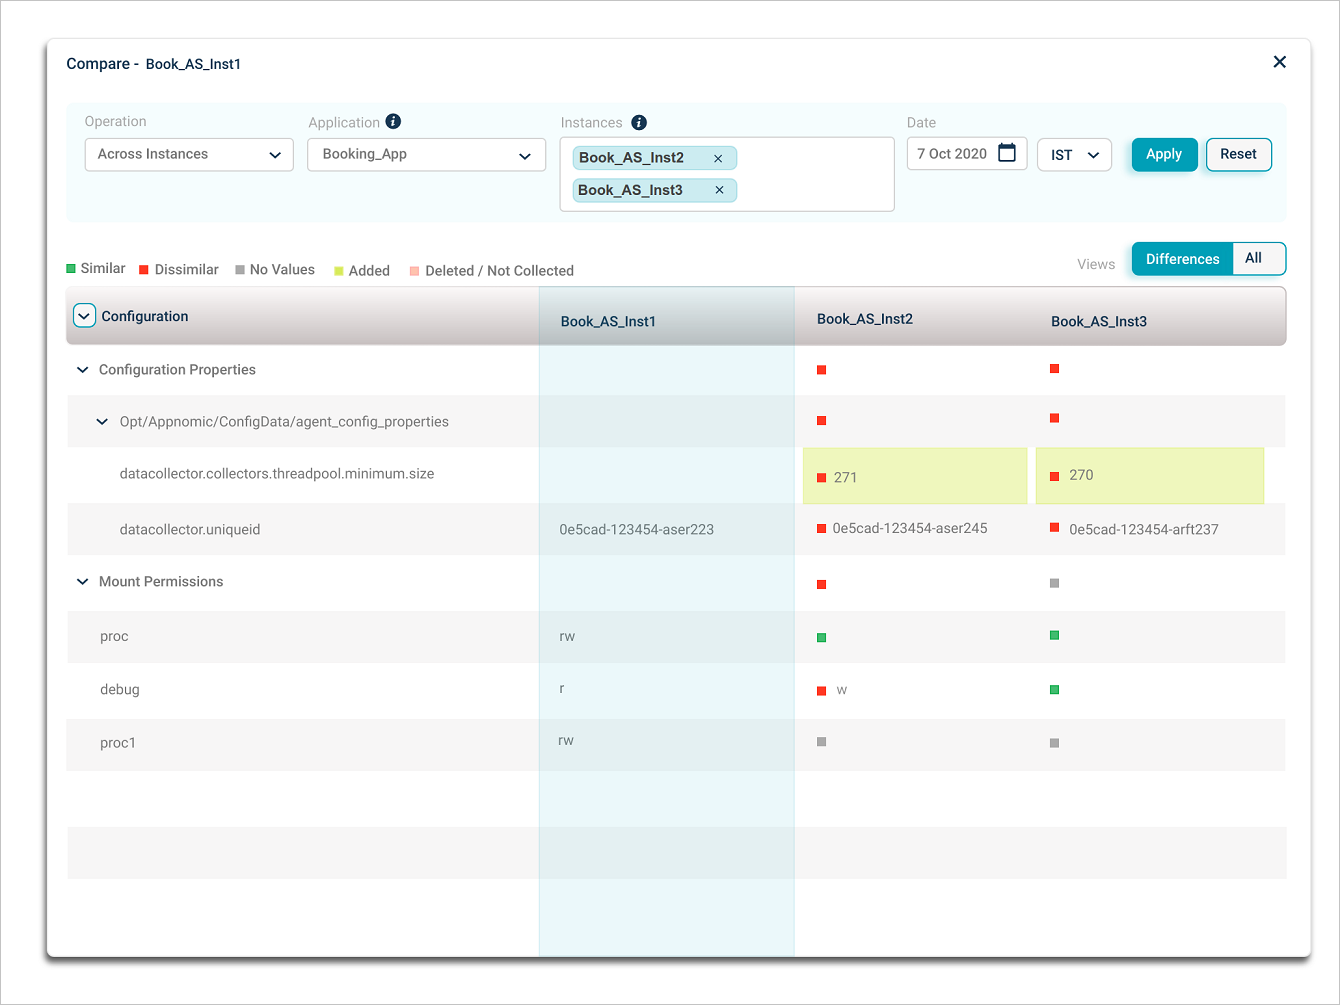
Comparisons run on common KPIs. If the base instance has 50 Config Watch KPIs and the others have 25, you see all 50 of the base, but only the 25 in common are compared. The remaining 25 show as Deleted or Not Collected.
Config Watch detects events for KPIs as:
- Added. A new KPI was added.
- Deleted / Not Collected. The KPI (file or property) was deleted, or the agent could not collect a value.
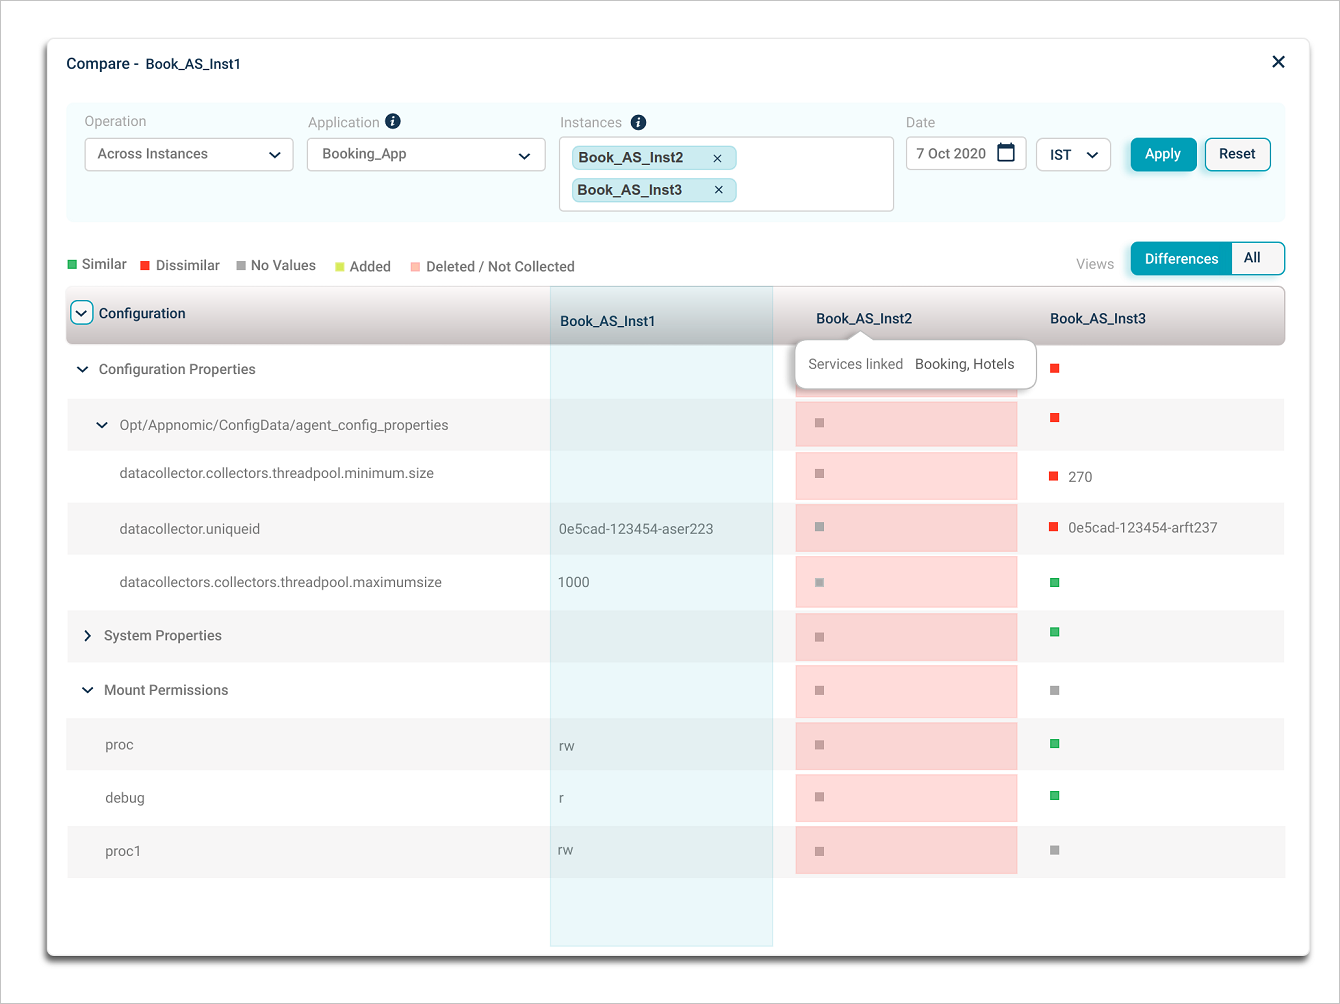
Hover a column name for a comma-separated list of services that the instance is part of. The cell background marks an event. The base instance is highlighted in blue. Deleted or Not Collected KPIs show No Values as the comparison result.
When there are no changes across the selected instances, you see this view.
Compare across timeline
Pick Across Timeline from Operation. Pick up to three dates to compare against the base date for the same host or component instance.
Click Apply. If the base instance has no data for the selected date, you see this view.

Pick up to three dates for comparison.
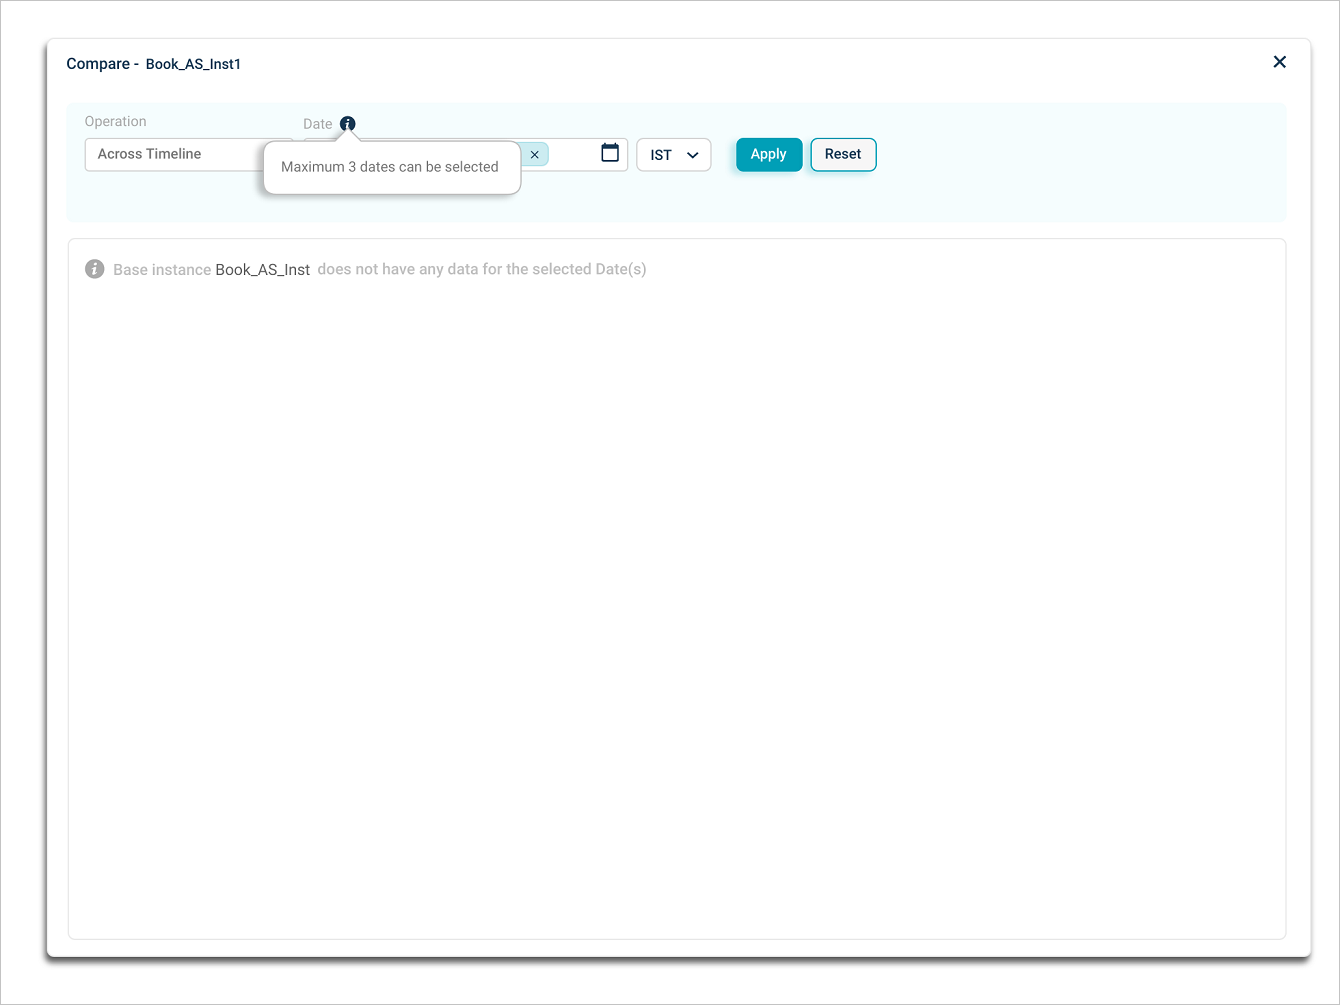
Click the Date box to add or remove dates. The base instance date is added automatically and cannot be removed.

If the base instance has data, the timeline comparison appears.

Next
- Viewing Application Health . the application-level dashboard.
- Signal Notifications . configure alerts.
- Transactions Audit Data and Reports . inspect transaction headers.