How Can We Help?
Search for answers or browse our knowledge base.


The Root Cause Walk diagram sits below the Root Cause summary on the incident page. It shows how correlated anomalies propagate across services to highlight the most likely component responsible for the incident.
What it shows
The view traces event data, telemetry, and causal dependencies between nodes (services, applications, infrastructure) to surface the first significant failure point in the impact path.
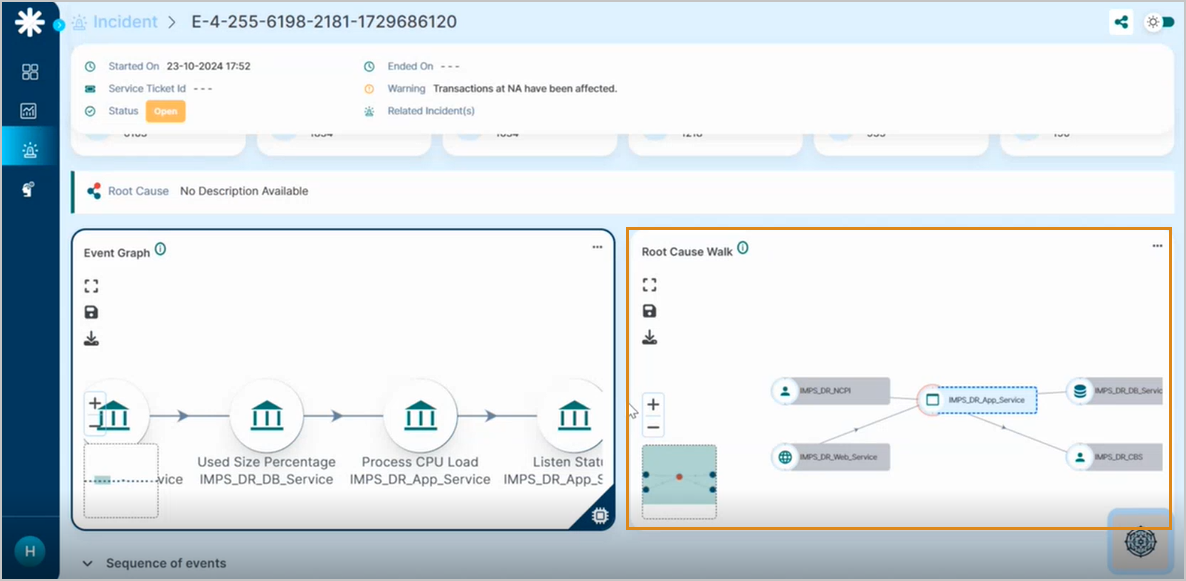
SREs use it to visualize complex incident paths quickly, so the origin of cascading failures takes less time to find.
Next
- Root Cause Analysis . automated RCA in HEAL.
- Event Correlation . the event-level graph for an incident.
- Incident Details . open one incident.