Search for answers or browse our knowledge base.


Workload Signature Display shows your application’s usage pattern as workload-cluster compositions over time. The Machine Learning Engine (MLE) builds clusters during each baseline so you can see what kinds of transaction mixes drive resource use.
How it works
HEAL correlates workload with system behavior. Key system metrics depend on the workload at any moment, so the expected behavior of each component is a function of that workload. During every baseline, the MLE forms workload clusters. Each cluster has a different transaction composition and a different impact on resources across nodes.
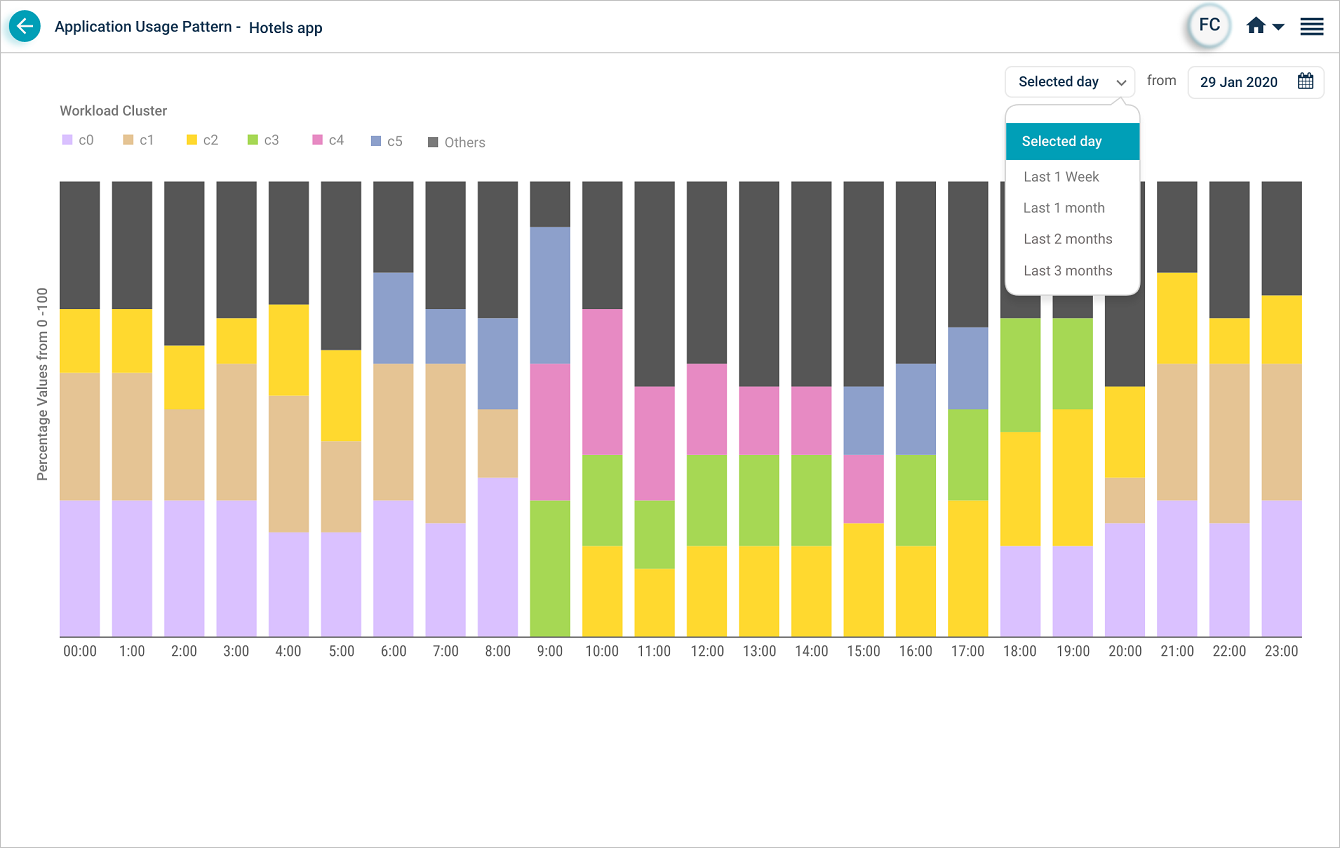
The display shows the top three workload clusters for the selected time period and rolls the rest up under Others. The number of clusters can change with every MLE baseline. Pick from these time ranges: 1 day, 1 week, 1 month, 2 months, or 3 months.
Example
Say an application has three transaction types: T1, T2, and T3. The MLE produces clusters C0, C1, and so on. C0 might contain 50 of T1, 70 of T2, and 20 of T3. Each minute, transactions arrive in some mix and the MLE fits the minute’s mix to the closest cluster. The percentage shown for a cluster is how often that cluster matched the mix in the time interval you picked.
Day view
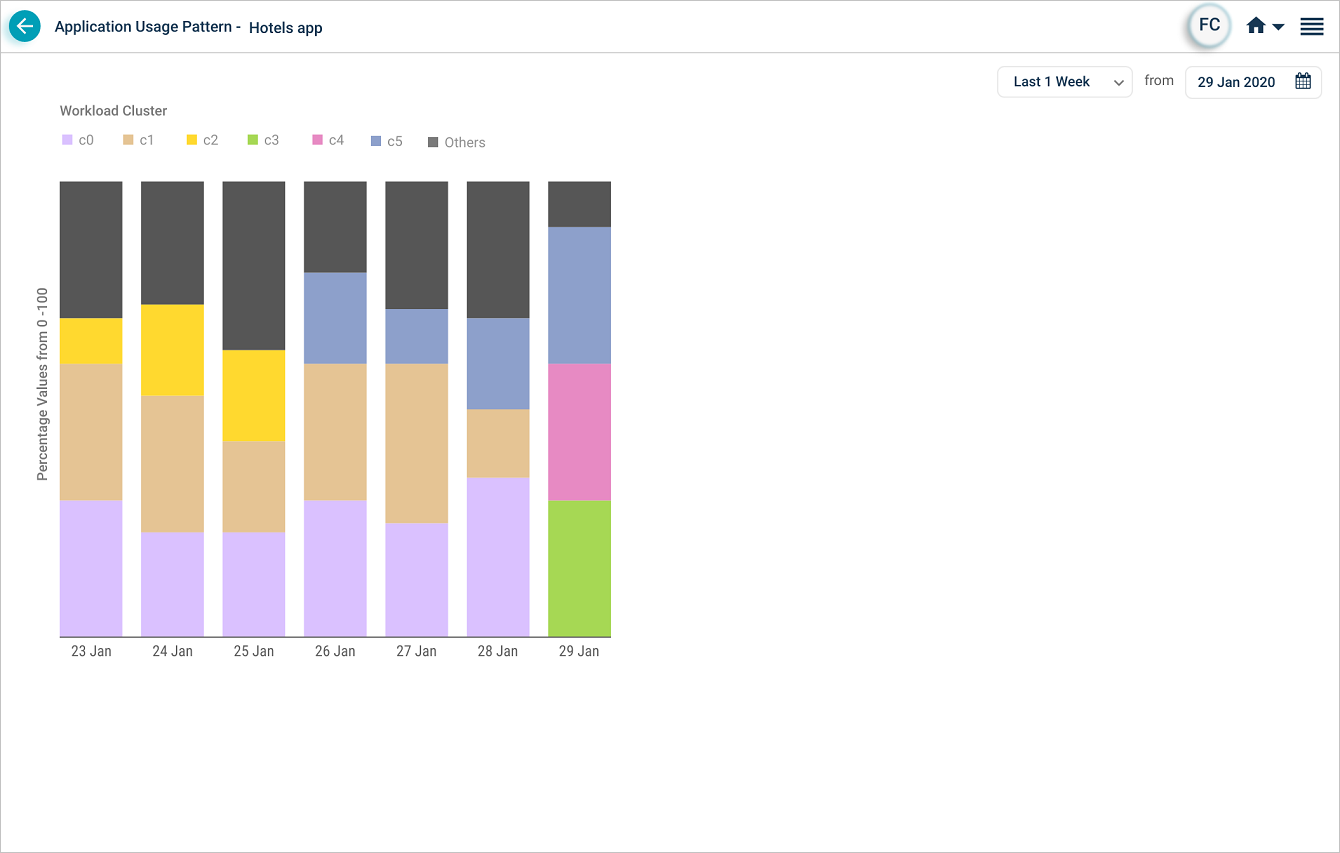
Week view
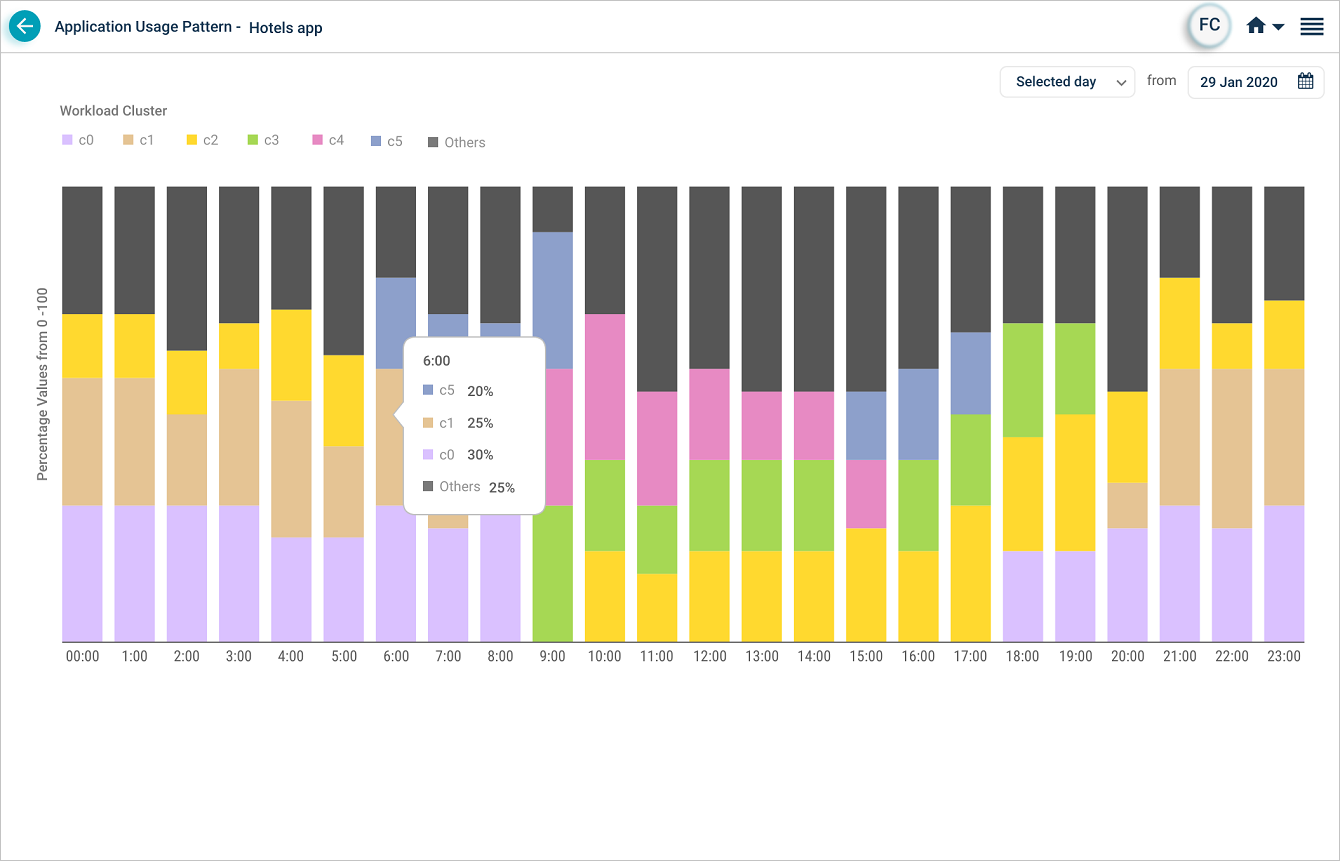
Hover any cluster to see its percentage at that moment in time.
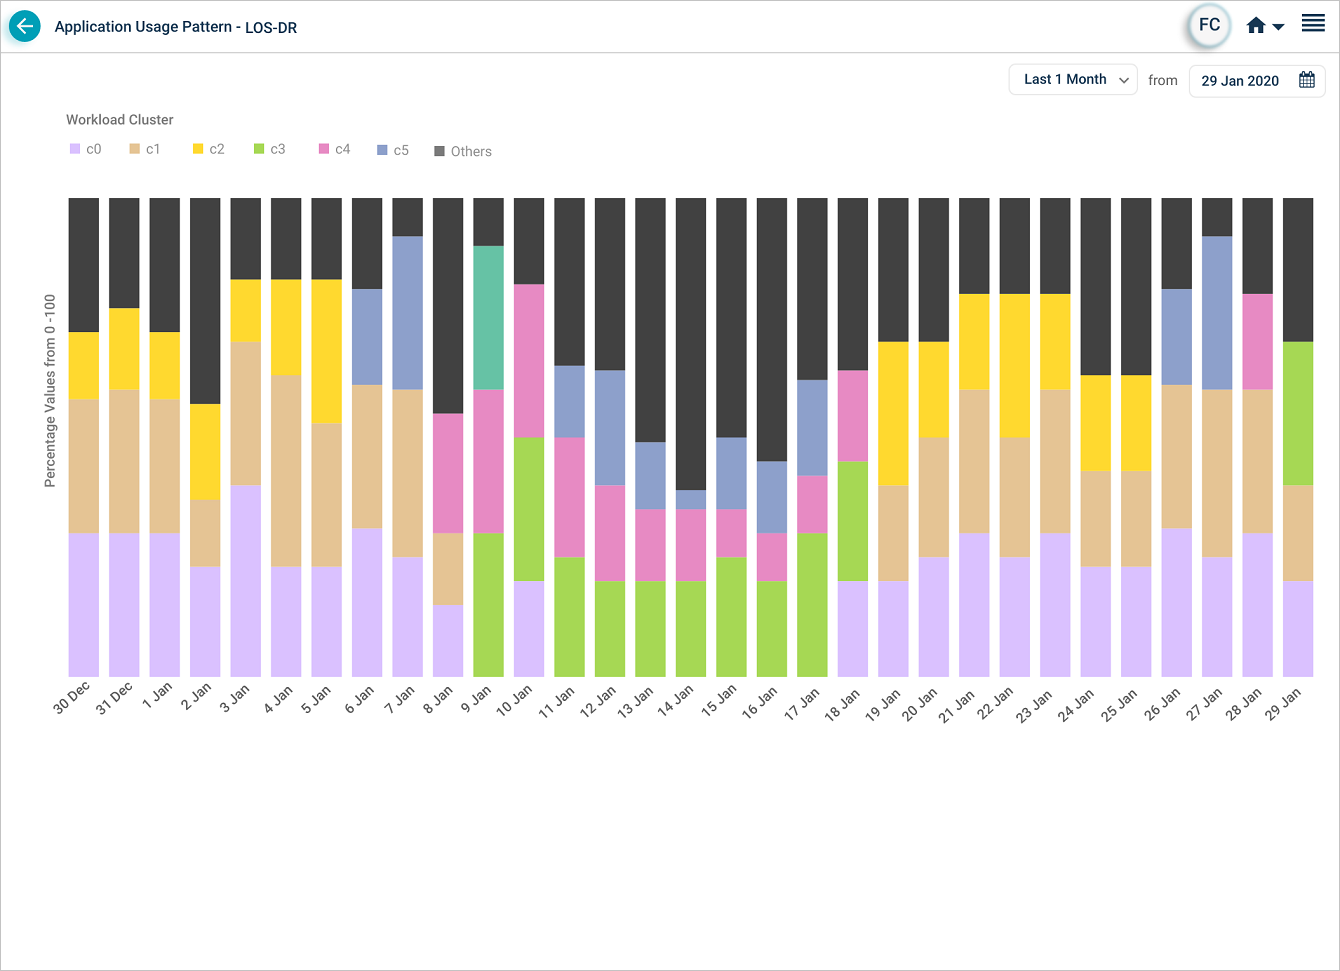
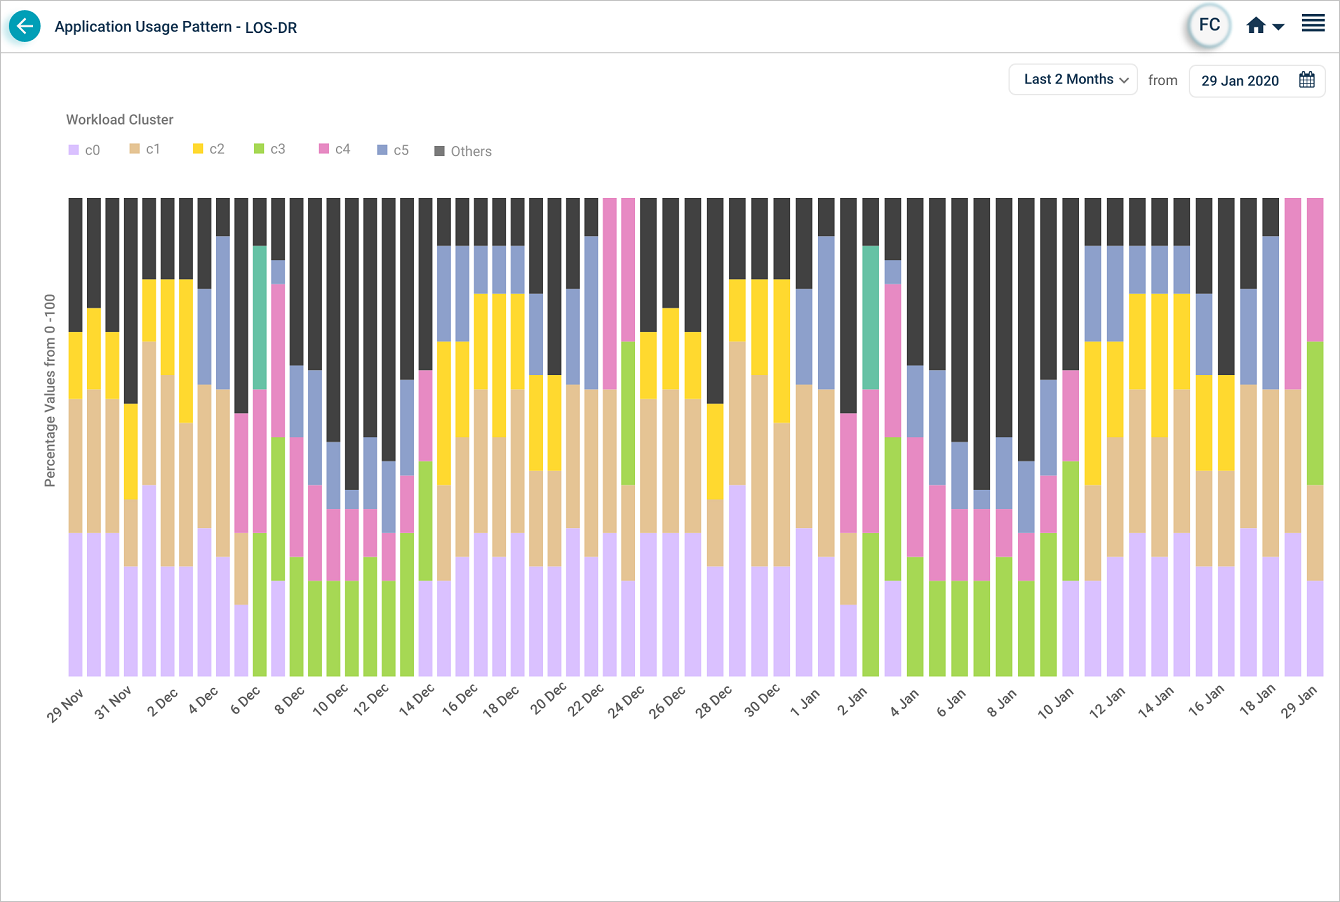
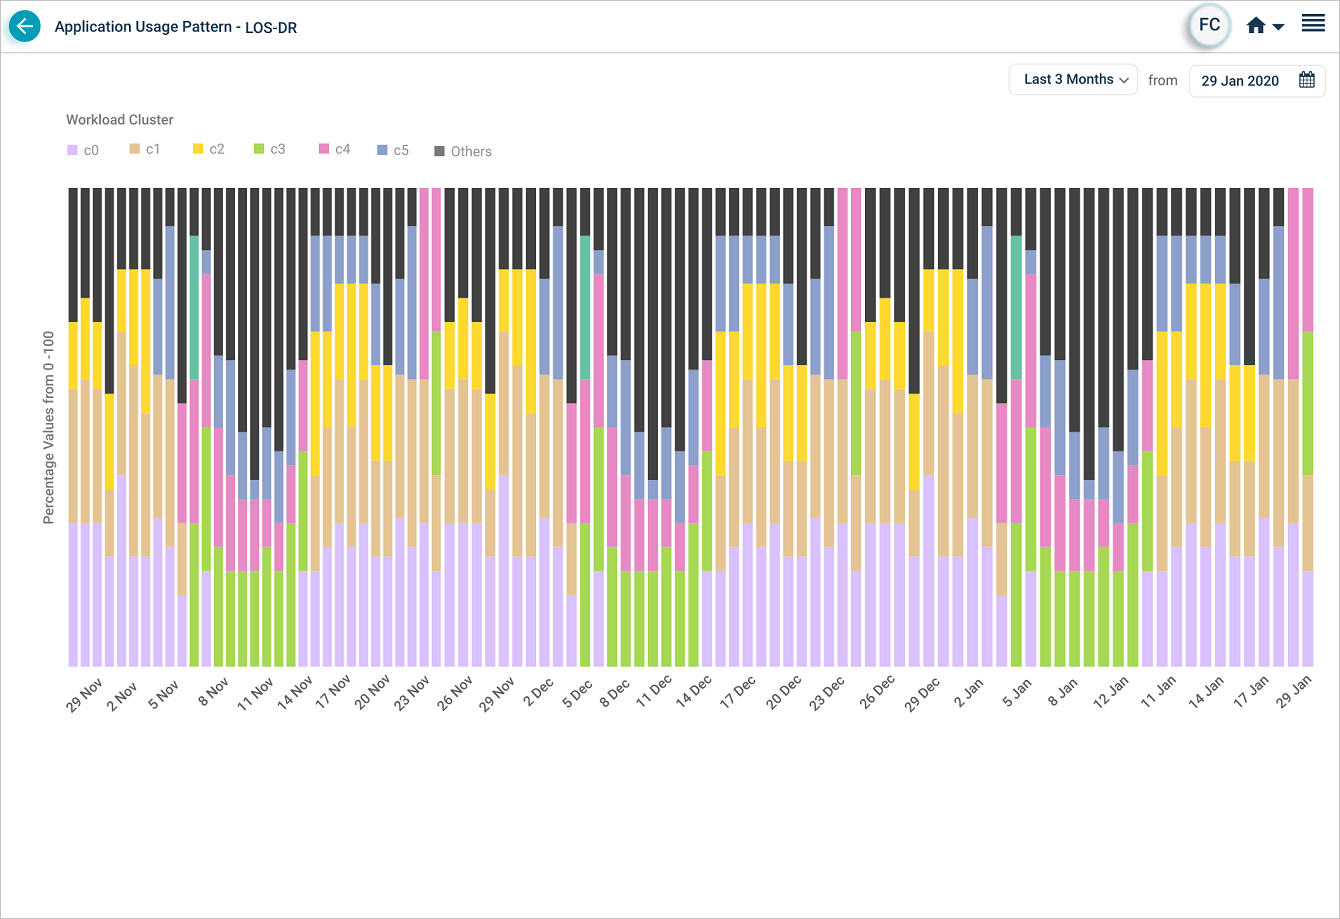
Month views
1 month
2 months
3 months
Next
- Viewing MLE Insights Dashboard . AI view of your most important metrics.
- Viewing Capacity Heat Map . weekly capacity trend.
- Viewing Application Health . the application-level dashboard.