Search for answers or browse our knowledge base.


A Problem signal is the notification HEAL raises when an unexpected condition affects a system or application. The Problem report drills into one Problem.
Open a Problem report
1. Open the Signals tab. See Navigating Signal Tab.
2. Click the Problem ID in the list, or click the Problem link in an email notification.
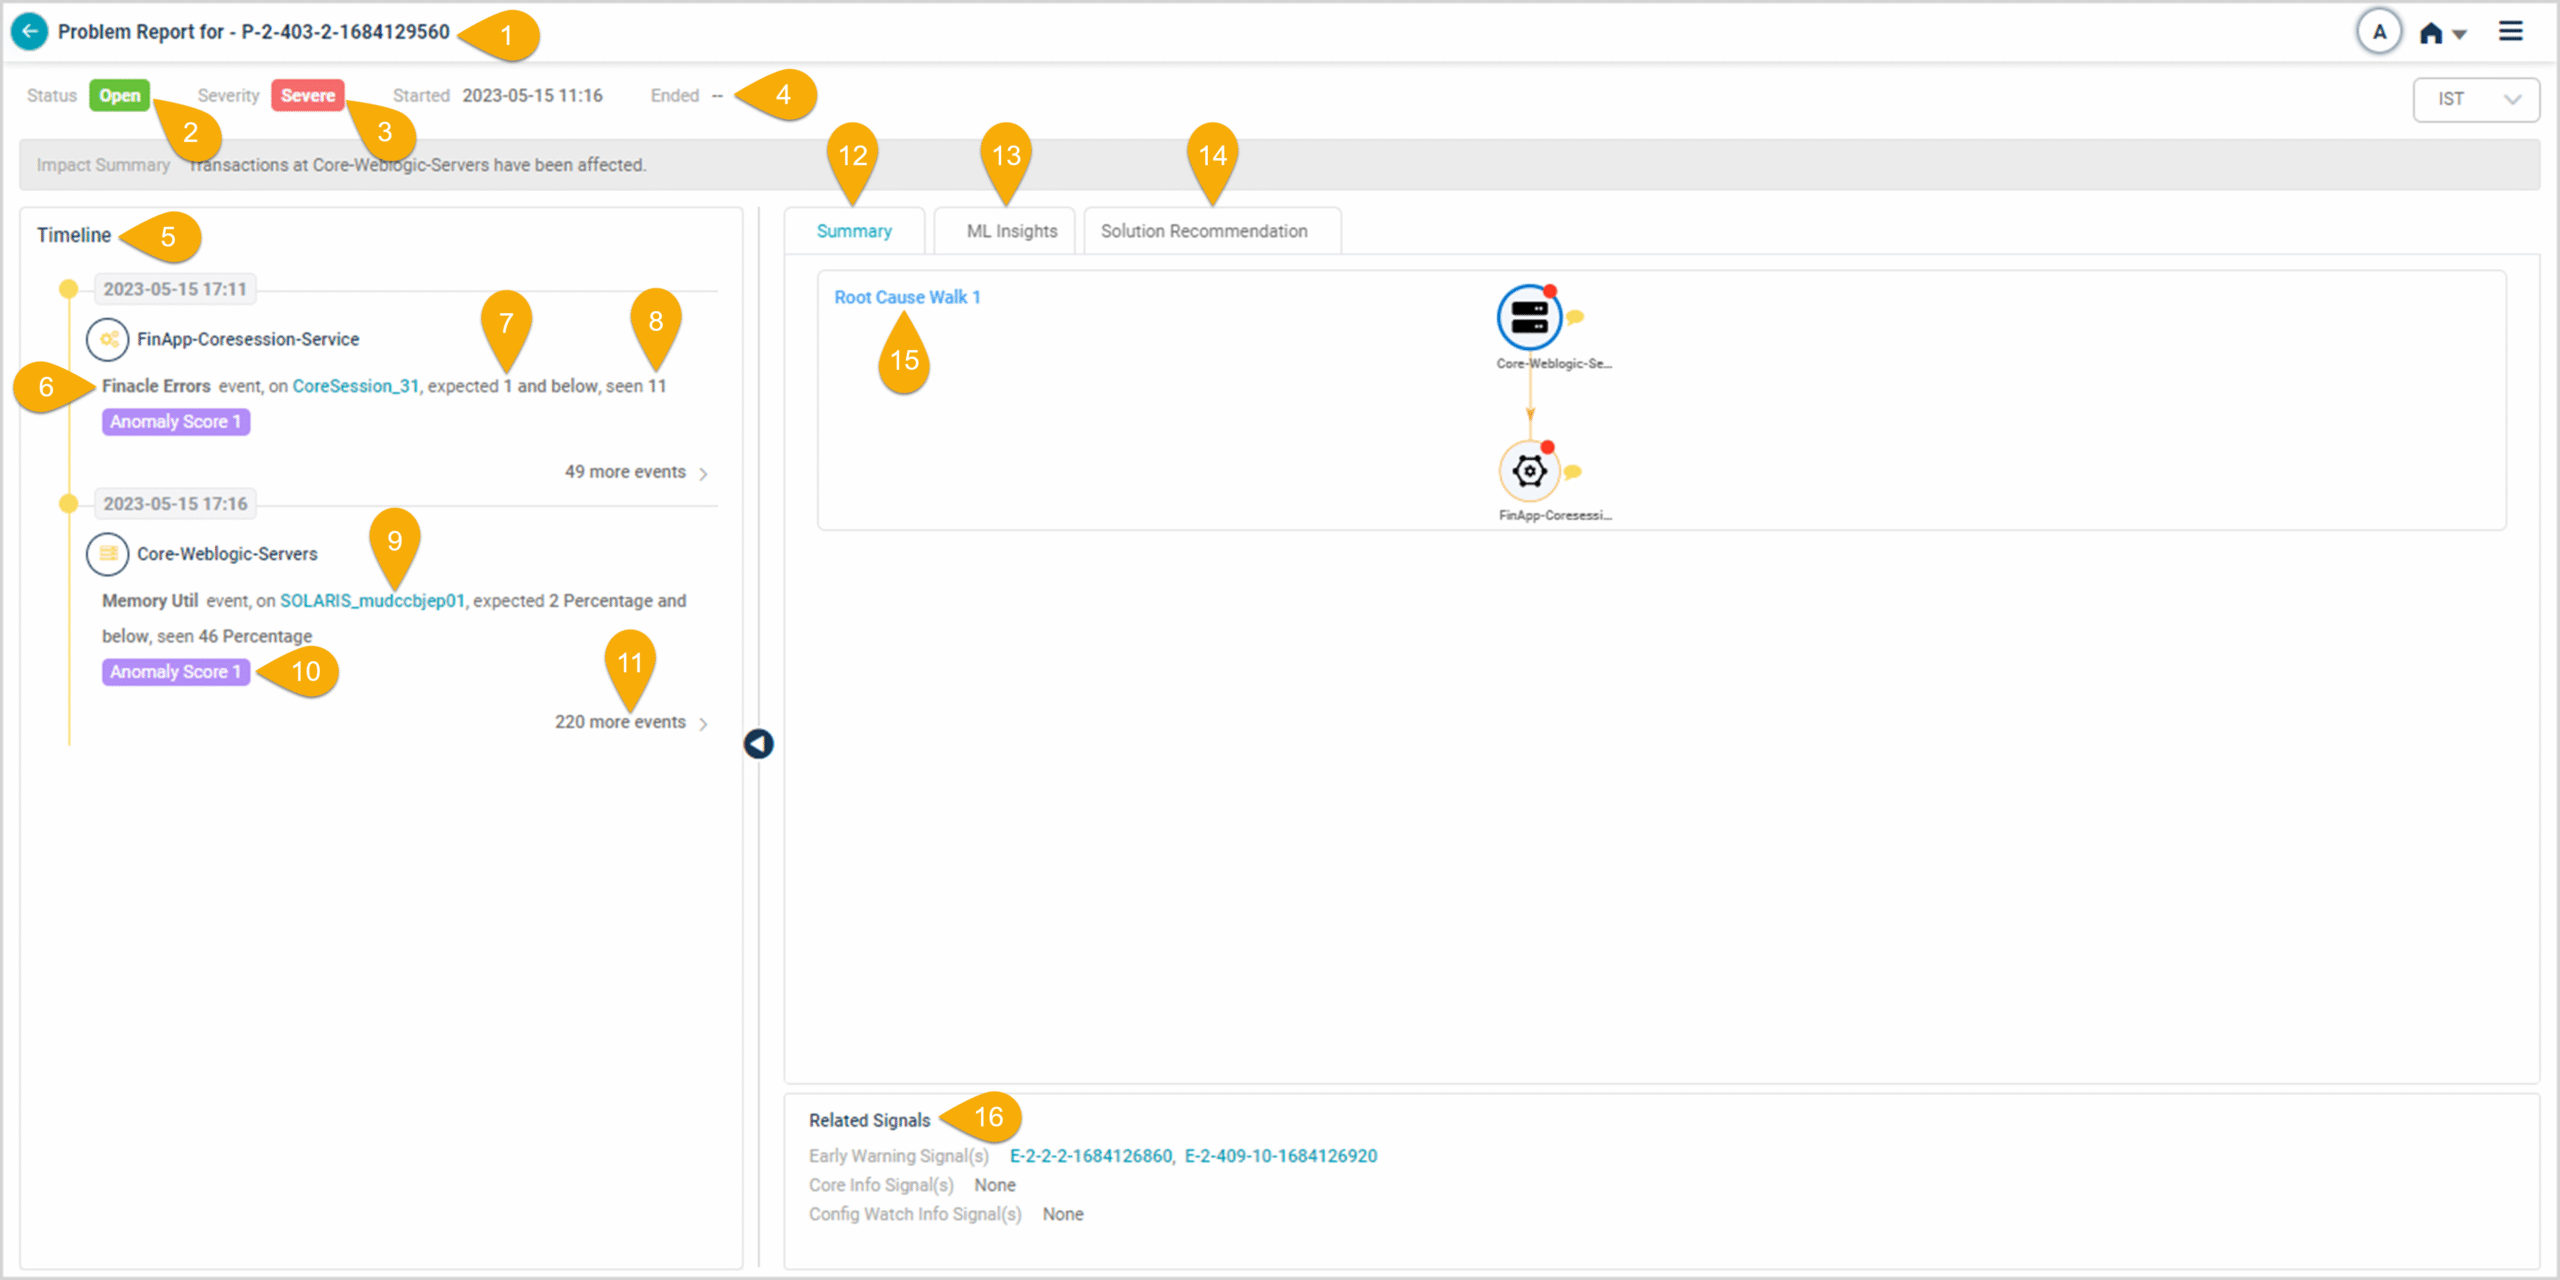
What’s on the screen
1. Signal Id. Unique identifier for the Problem.
2. Status. Open, Closed, or Upgraded. Open means the Problem is still active. Closed means resolved.
3. Severity. How intense the signal is.
4. Signal Timeframe. Start time when the signal opened, end time when it closed or was upgraded.
5. Timeline. Chronological breakdown of affected services. The MLE builds the sequence using ensemble modeling. You only see services in applications you have access to.
6. Violated KPI. Name of the KPI that crossed its threshold.
7. Current KPI Value. The KPI’s value at the time of the event.
8. Normal Operating Range. The NOR for the KPI. See Service Details Dashboard.
9. Instance. Each event ties to a specific cluster or instance. Click the instance to open Instance Details.
10. Anomaly Score. A number between 0 and 1 that reflects how severe the event is. Higher means more severe.
- Shown only when the MLE generated the event.
- Not applied to events from a Static Operating Range (SOR).
11. Event expand or collapse. Expand to see every event for a service in time order. Collapse to clear the view.
12. Summary. A summary of the signal with the RCA Walks listed.
13. ML Insights. Top ten critical metrics for services in the timeline. See ML Insights.
14. Solution Recommendation. Top three suggested solutions for the root cause. See Solution Recommendation.
15. Root Cause Walk. A visual map of services that may be the root cause. Click Root Cause Walk to open the details in a new tab. See Root Cause Analysis.
16. Related Signals. Other Early Warnings or Problems linked to this one. If an Early Warning was upgraded to this Problem, that Early Warning ID appears here.
Lifecycle of a Problem
HEAL generates a Problem when transaction events fire on an entry-point service. The events come from Slow, Fail, Timed Out, or Unknown.
- A Problem can be created based on transaction events at the entry-point service alone, even when other behavior metrics show no events.
- A Problem can come from an existing Early Warning. If multiple events fire along the path of the Early Warning and the connected entry-point service has transaction events, the Early Warning is upgraded to a Problem.
- One Problem is created per entry-point service.
A Problem can move from Default to Severe if it starts with events in Slow and then picks up events in the other categories. Once Severe, it stays Severe for the rest of its lifecycle.
More events on the same service or services in the same line as the original service get rolled into the same Problem.
A Problem closes when every metric with events returns to normal.
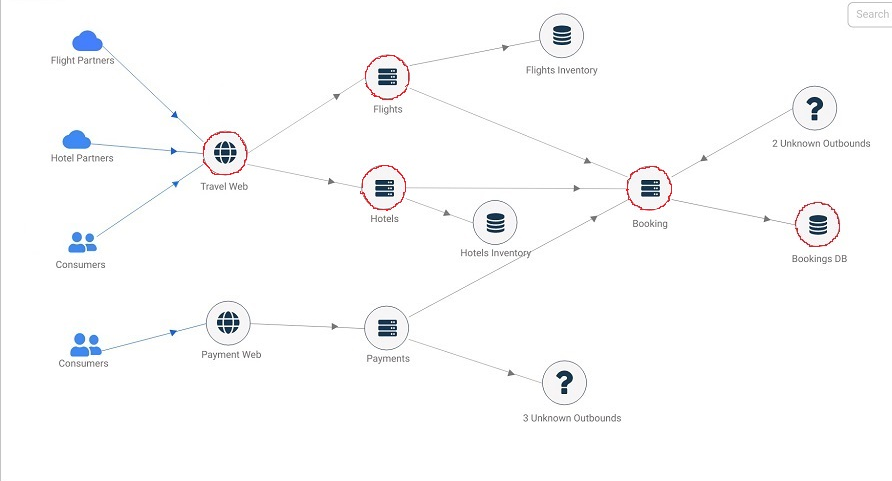
Example 1
Travel Web requests have events.
- The Early Warning is resolved.
- A Problem is generated.
- One Root Cause walk is available.
- Path 1: Bookings DB → Booking → Hotels: Flights → Travel Web
- The resolved Early Warning is marked as a related signal.
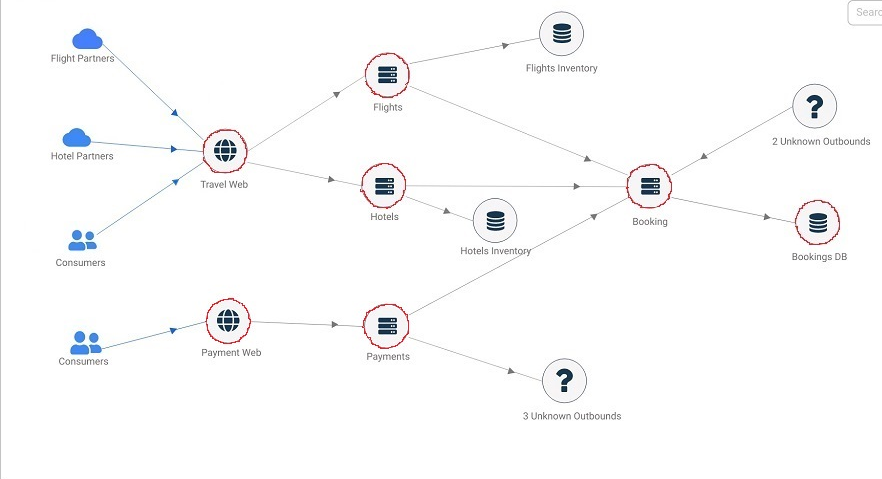
Example 2
Payment Web requests have events.
- A new Problem is generated.
- One RC walk is available.
- Path 1: Bookings DB → Booking → Payments → Payments Web
- The timeline includes services along this path where events fired.
- The Early Warning and the previous Problem are marked as related signals.
Next
- View Early Warning Report . open one Early Warning.
- Root Cause Analysis . see the Root Cause Walk.
- View Solution Recommendation . suggested fixes.