Search for answers or browse our knowledge base.


The Service Details Dashboard is the per-service drill-down. Open it from the Service Dependency Map to see instance health, KPIs, signals, and events for one service.
What you can do here
- Read the health of one service at a glance.
- See every instance running behind the service.
- Track workload and behavior KPIs.
- Spot performance issues and dig in.
- Understand dependencies between services.
Open the Service Details Dashboard
In the Application Summary Service Dependency Map, click any service.
What’s on the screen
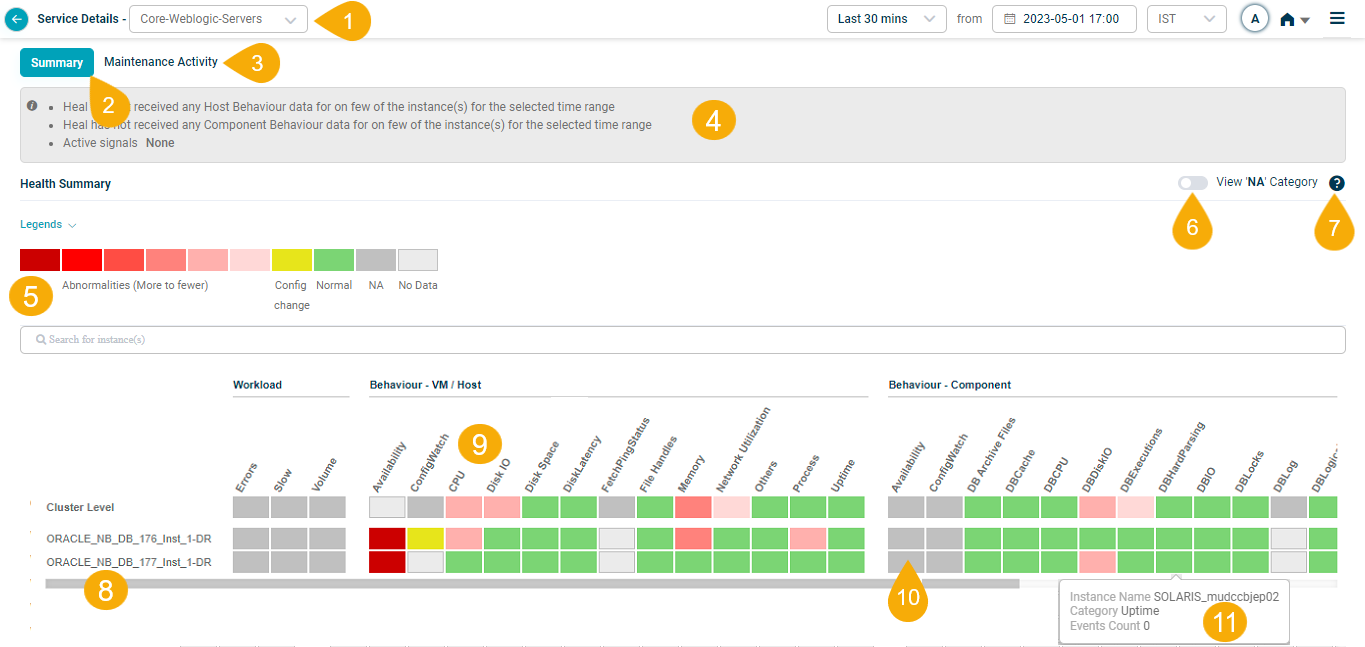
1. Service selection. Switch between services. The service you opened is selected by default.
2. Summary tab. Quick view of service health and performance.
3. Maintenance Activity tab. Track maintenance progress and any issues that came up during it.
4. Data overview. Description of what is shown.
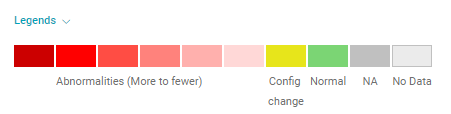
5. Legends. Color-coded key for the data on the dashboard. See Legends below.
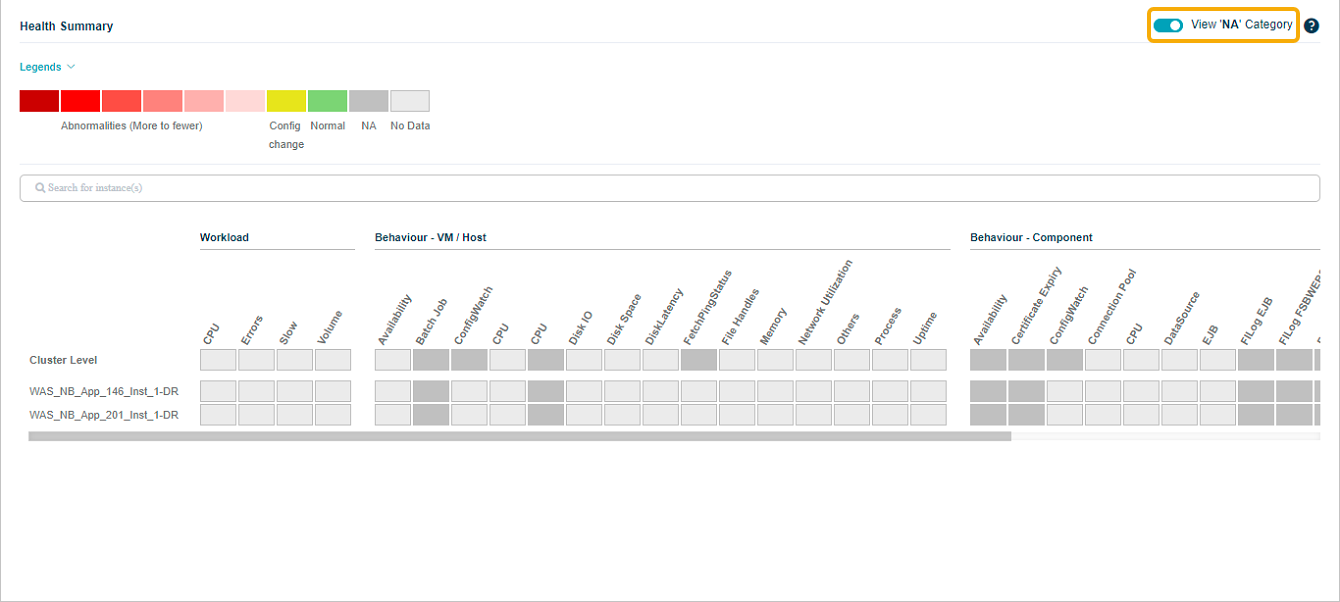
6. View NA category. Show or hide categories that are Not Available. Off by default for readability.
7. Help. Open the in-screen help for the dashboard.
8. Instances. Listed alphabetically. If a service uses host instances only, only those appear in the heat map. The Cluster Level option shows cluster-level data on top.
- Scroll across to see all instances when there are more than fit on screen.
- Hover a component instance to see the host IP it runs on.
9. Metric categories. Listed alphabetically. Workload and Behavior KPIs at VM/Host level and Component level. See KPI types below.
10. Block. Each block is one category for one instance or cluster. Easy way to see how categories spread across instances.
11. Hover event display. Hover any block to see the event count for that KPI category at that instance or cluster level.
Events
HEAL raises events when metrics fall outside two threshold types: Normal Operating Range (NOR) and Safe Operating Range (SOR).
NOR (Normal Operating Range)
A dynamic threshold built from historical behavior. When the system drifts outside the NOR, that may signal a problem.
- Compares the time series with upper and lower limits derived from history. Points outside the limits become events.
- The MLE owns the algorithm and updates it on a schedule.
- Data is split into 24 groups (one per hour of the day) so each hour gets its own thresholds.
SOR (Safe Operating Range)
A static range of an extreme high and an extreme low value. Two flavors:
- Automatic SOR. Generated by the system from recent metric values. Triggers an anomaly even when the metric looks otherwise normal.
- Manual SOR. Admins set their own range to override the automatic one.
SOR or availability KPIs have persistence and suppression rules at the service level. Change them in the Control Center.
KPI types
HEAL groups KPIs into two types.
Workload KPIs. Measure load. Volume of requests and responses, plus the status and response time of those requests.
Behavior KPIs. Show how the monitored instances actually behave. Two sub-types:
- Performance metric. Numeric performance data from component and host instances.
- Availability metric. Up-or-down state of instances and ports. Binary (0 or 1).
Legends
Click Legends for a color-coded key to the dashboard.
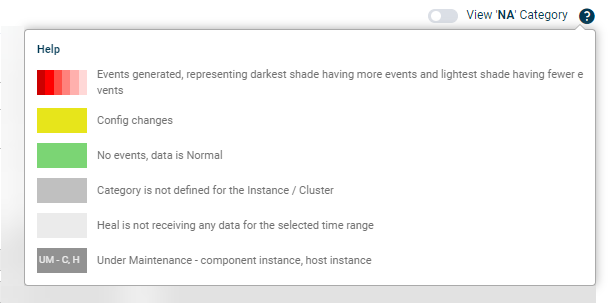
Help
Click the help icon ![]() on the Service Details dashboard to open in-screen help.
on the Service Details dashboard to open in-screen help.
View NA categories
NA (Not Available) categories are hidden by default for readability. Switch the slider to ON to show every category at both cluster and instance level, even when the KPIs are NA.
Next
- Viewing Service Details . full walkthrough of the per-service screens.
- Application Summary . the application-level drill-down.
- Navigating Signal Tab . problems and early warnings.