Search for answers or browse our knowledge base.


Click any service in the Service Dependency Map to open Service Details. The screen shows the service’s instances, workload and behavior KPIs, active signals, and events at the moment you opened it.
Last login timestamp
Every screen shows the date and time of your last login in the top-right corner.
Events
HEAL raises events when a metric falls outside one of two thresholds.
Normal Operating Range (NOR)
Also called the Dynamic Range. A series of high and low values the application learns over time. The Machine Learning Engine (MLE) builds the NOR using load-and-behavior correlation, then keeps it current. The thresholds are stored as time-series value ranges.
Safe Operating Range (SOR)
A static range with a high and low value set by an admin from current metric values. SOR and availability KPIs follow persistence and suppression rules at the service level. Admins can change those rules in the Control Center.
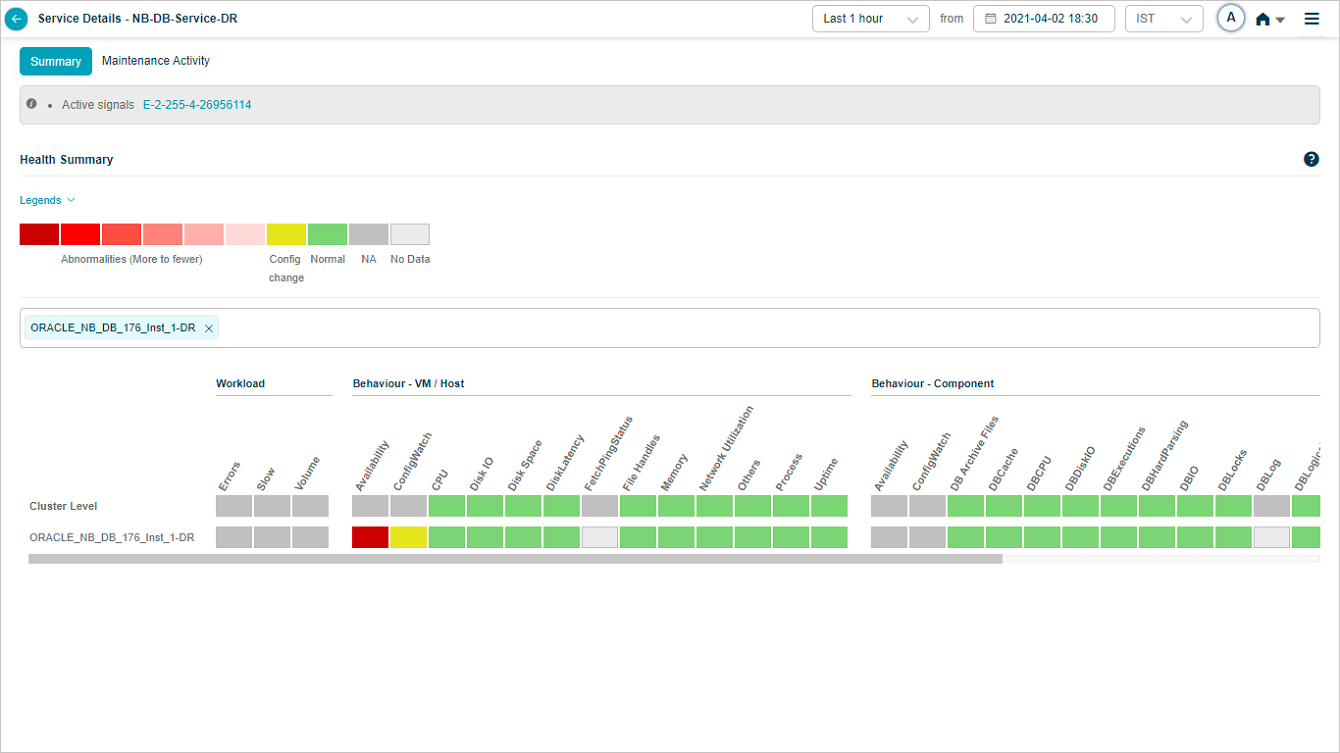
KPI types
Workload KPIs. The volume of load the instance is serving (requests and responses), plus request status and response time. Business information in the response feeds the Experience Journey. Requests are technical calls (for example, a URI call) coming in from an external actor or another service.
Behavior KPIs. How the monitored instances behave. Two sub-types:
- Performance metric. Numeric performance data from component and host instances.
- Availability metric. Up or down state of instances and ports. Binary (0 or 1).
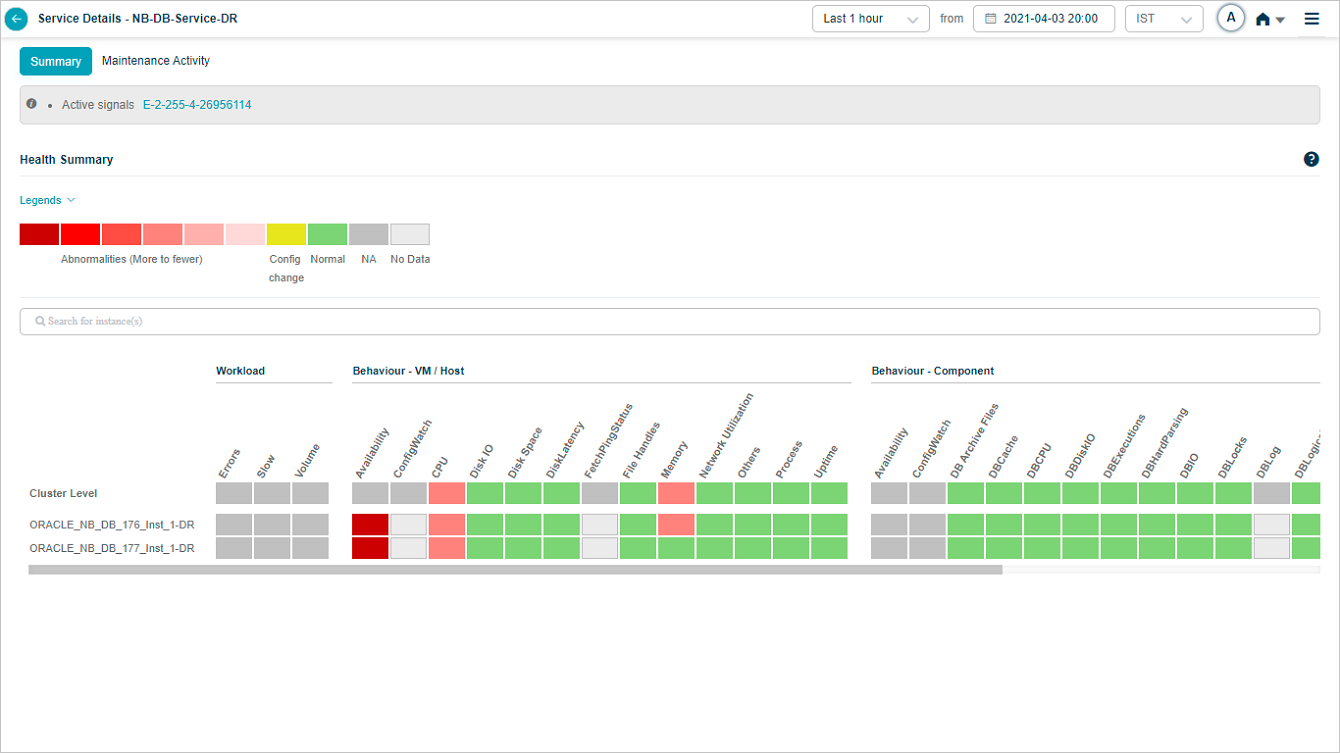
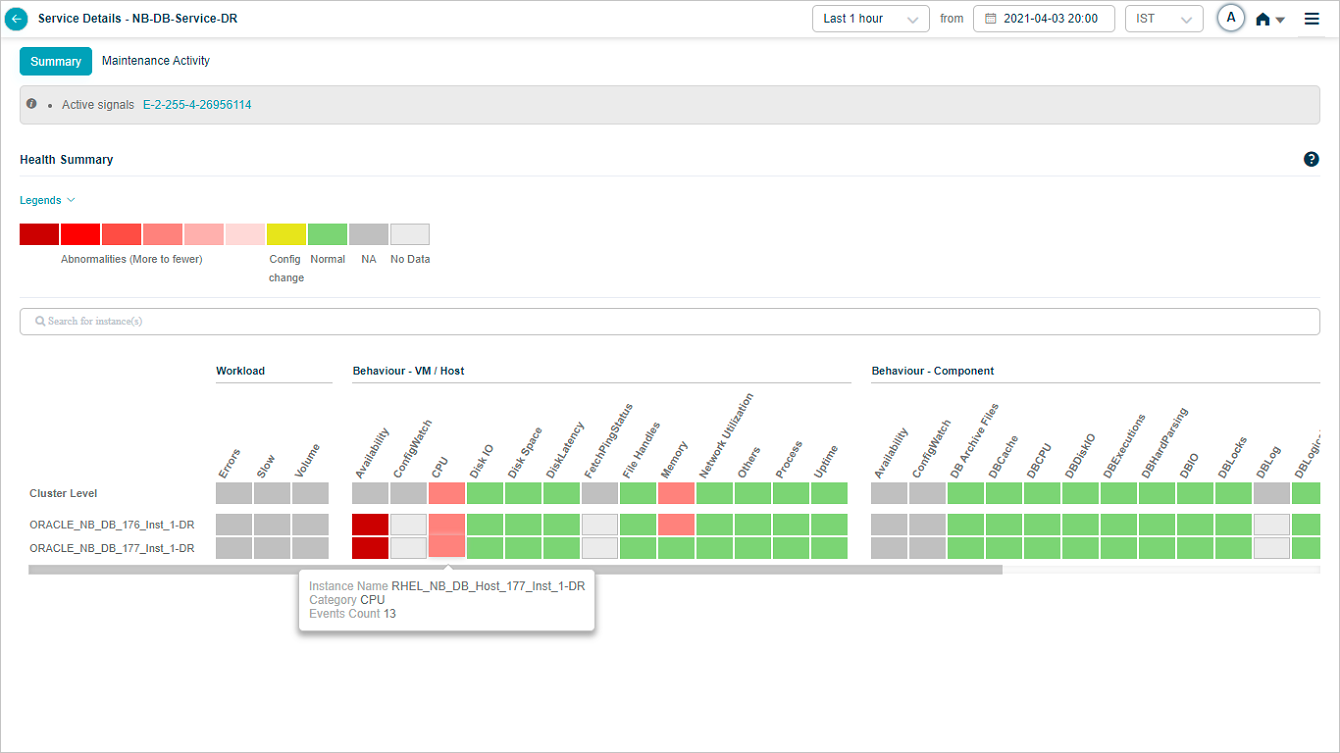
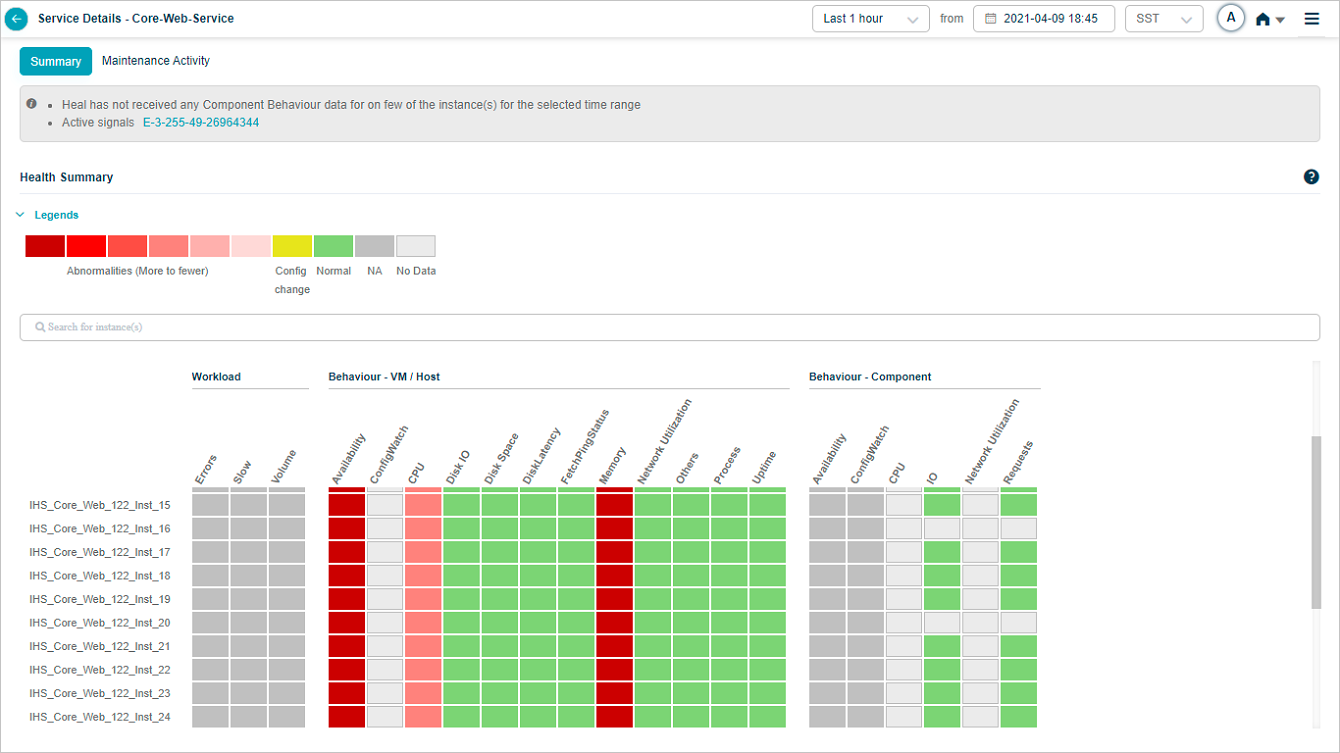
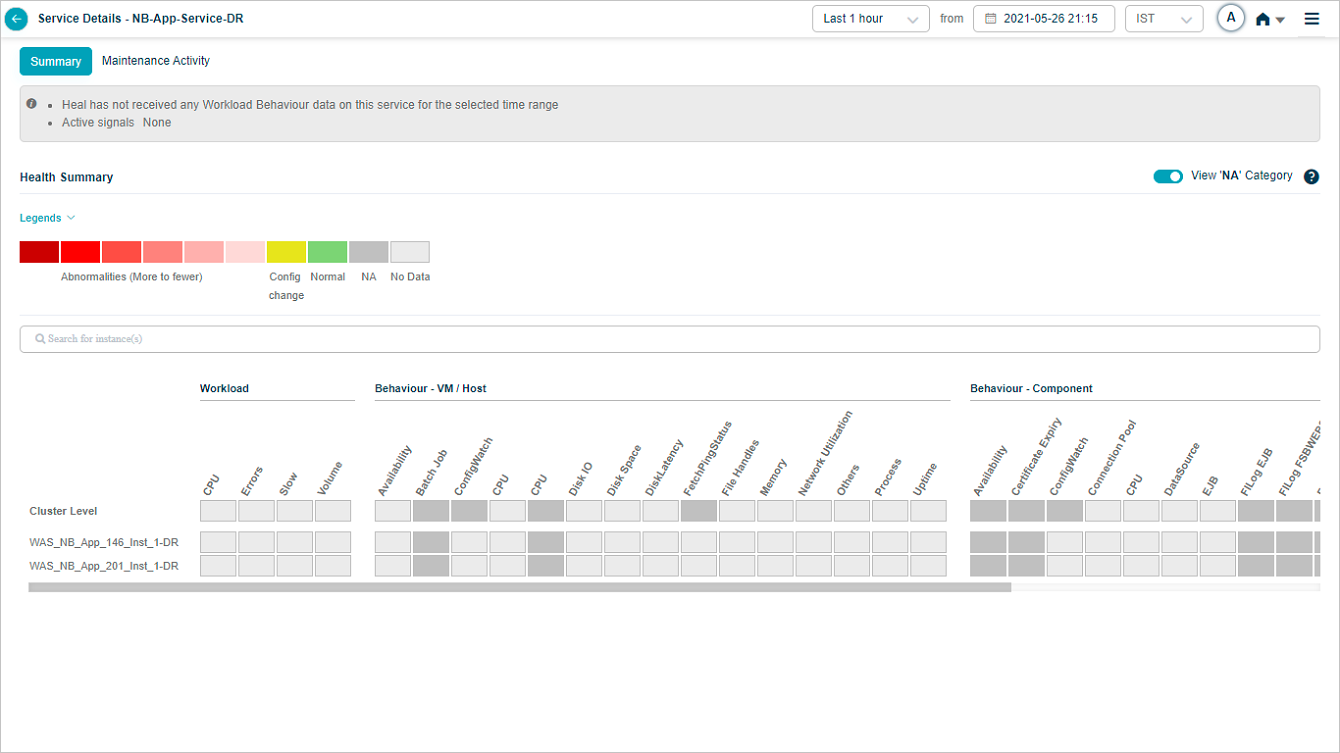
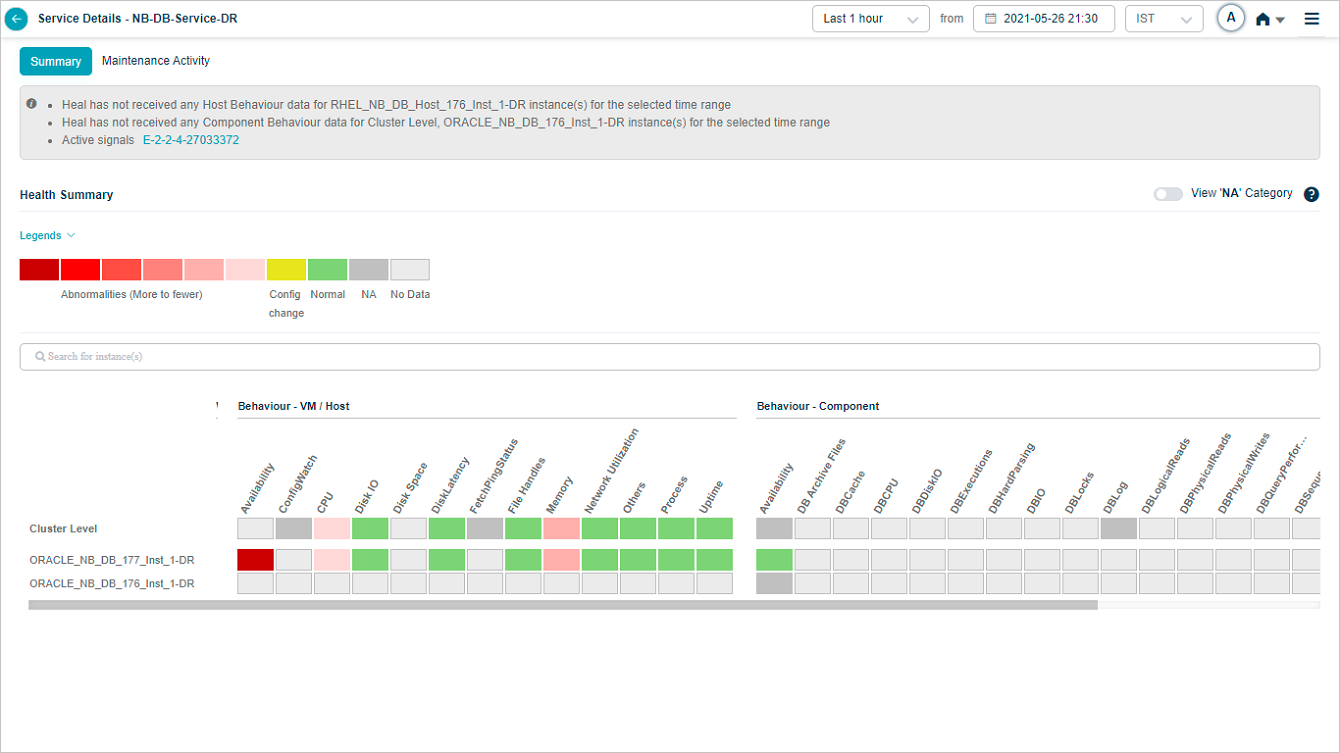
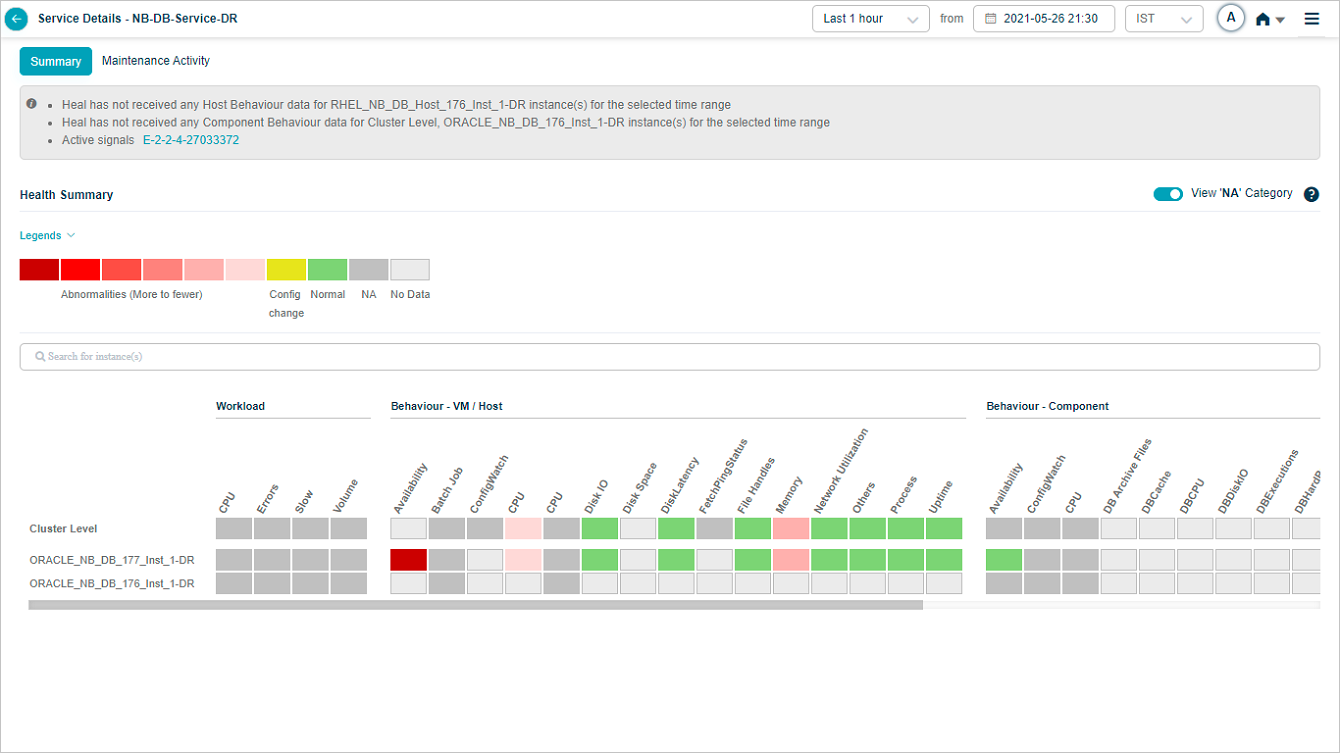
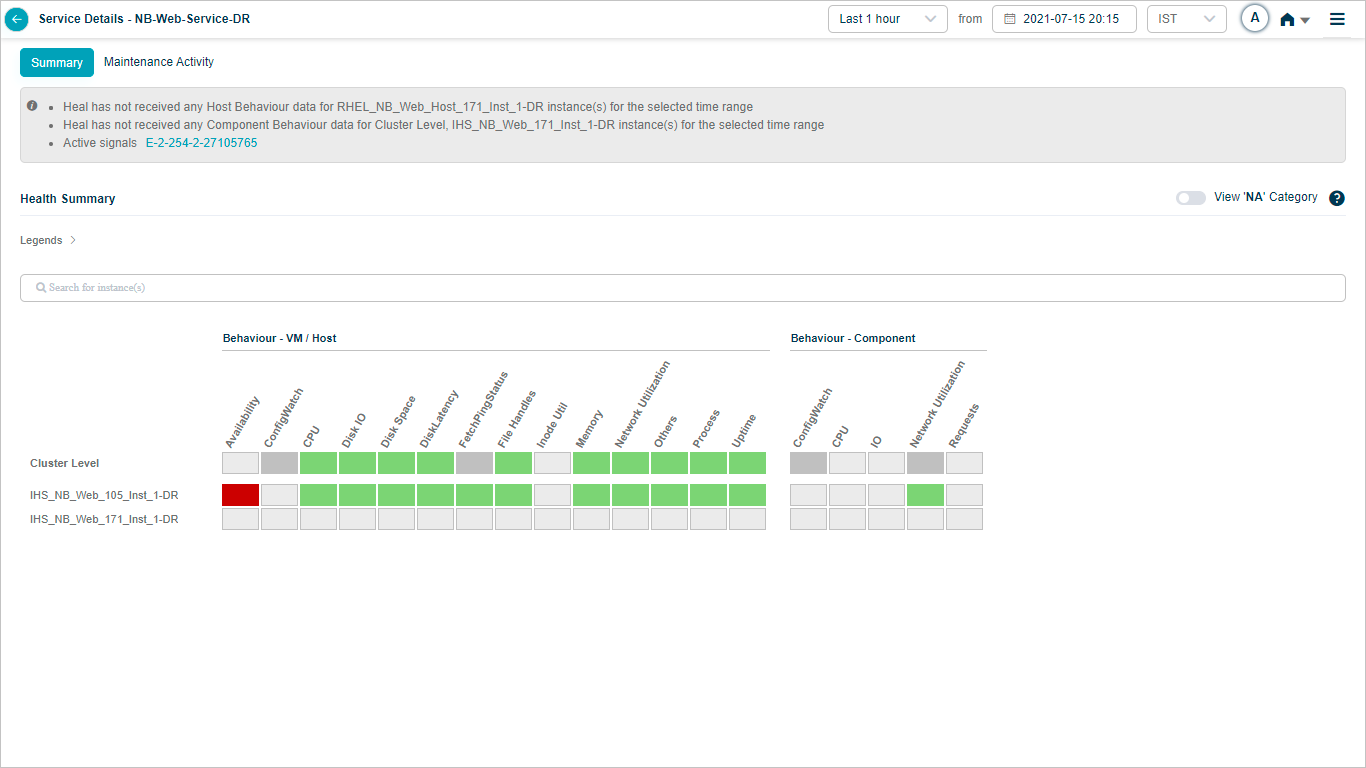
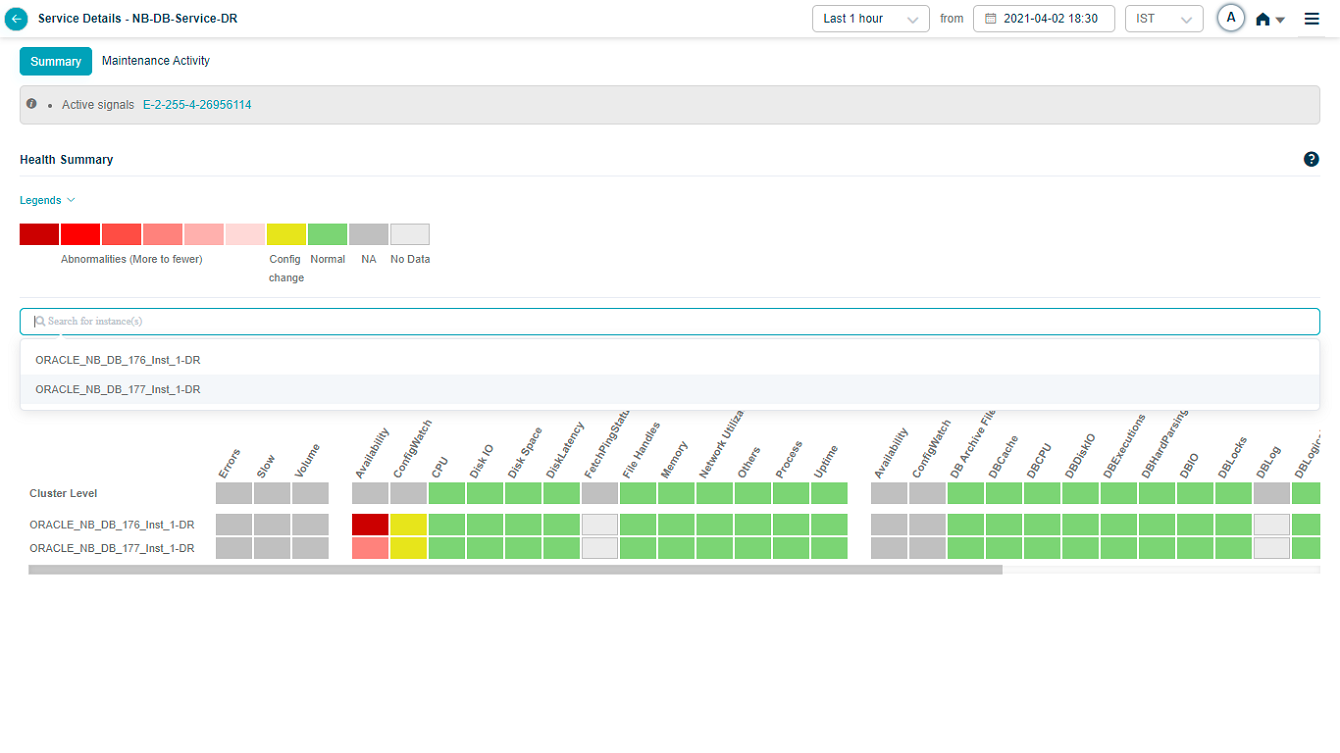
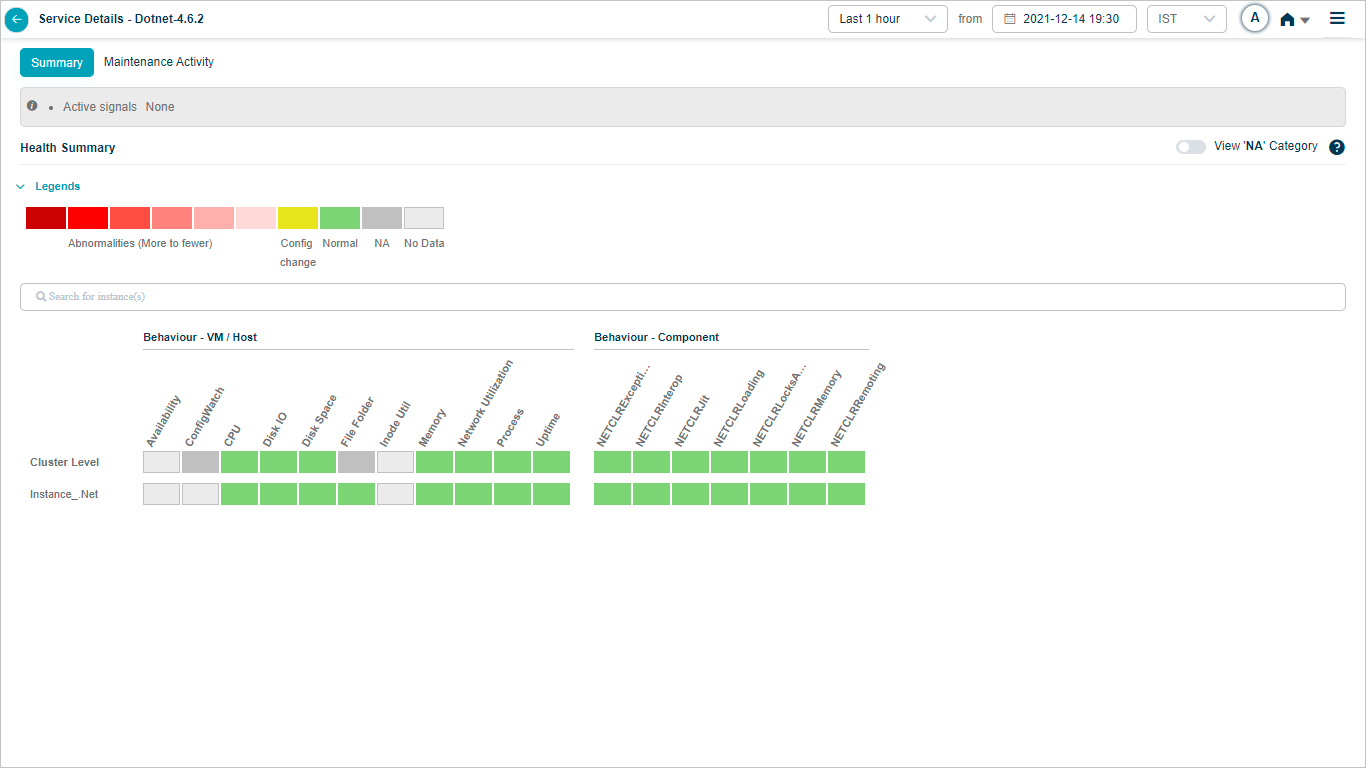
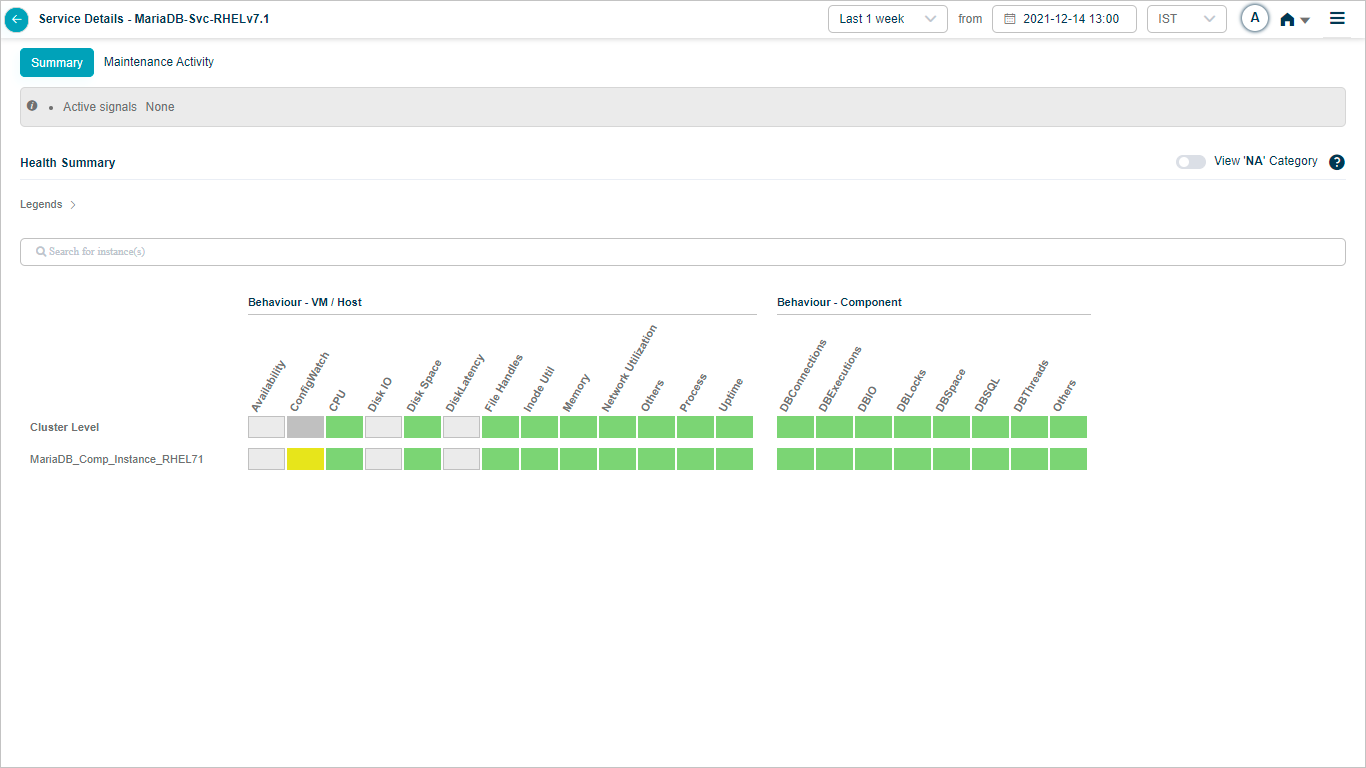
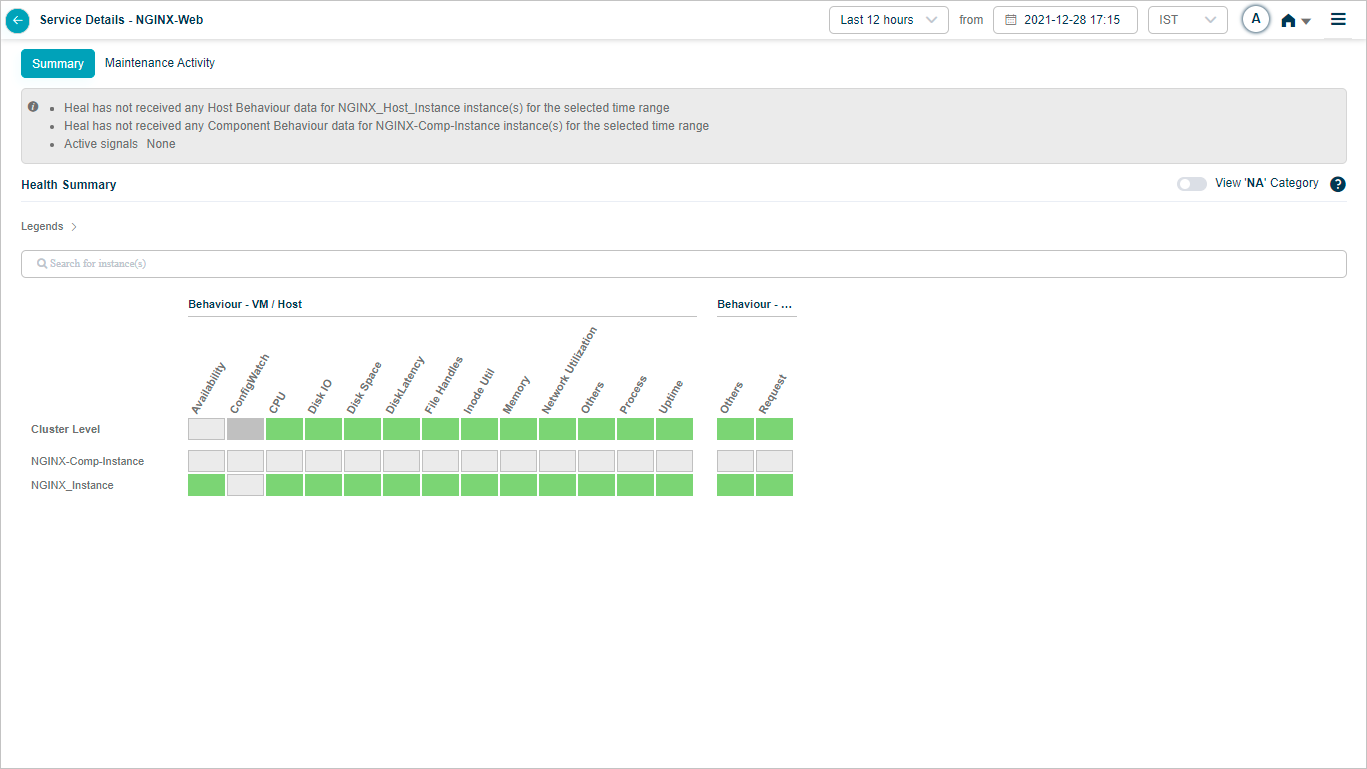
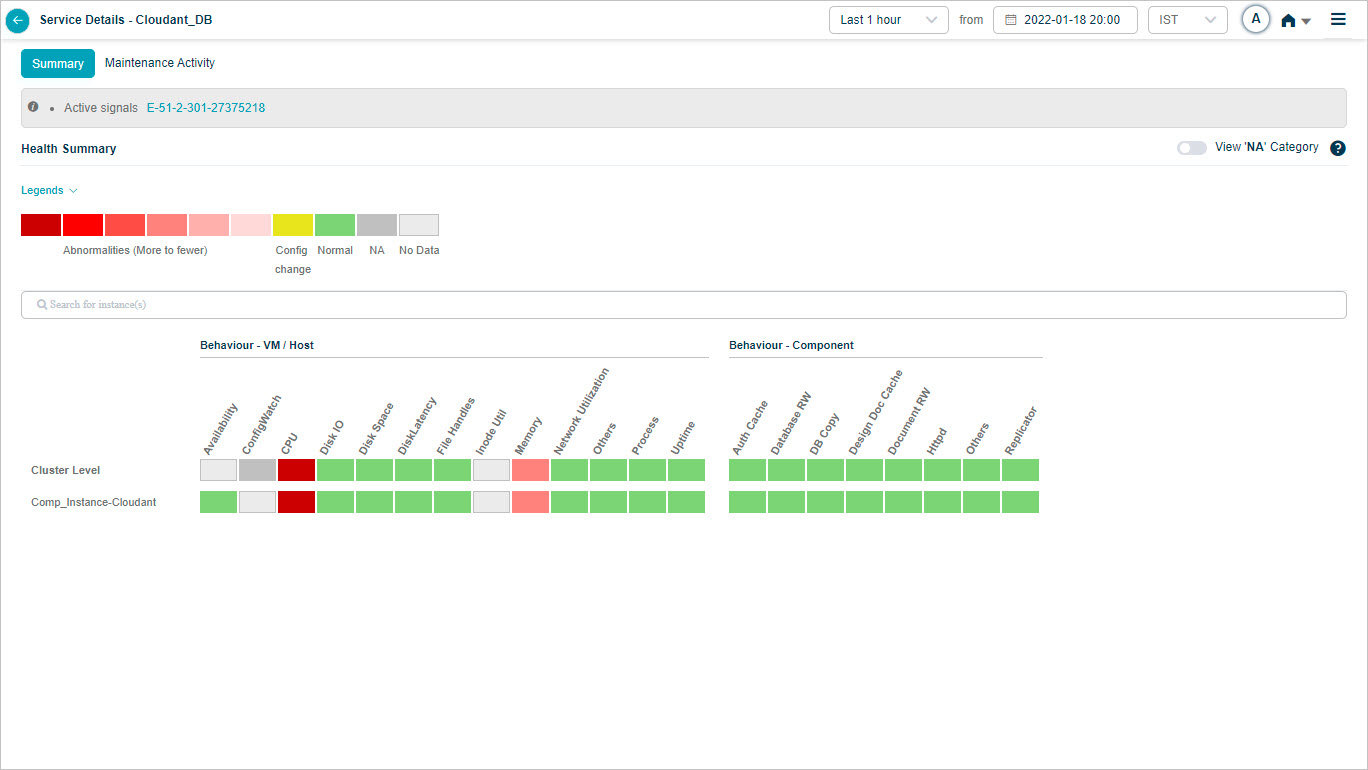
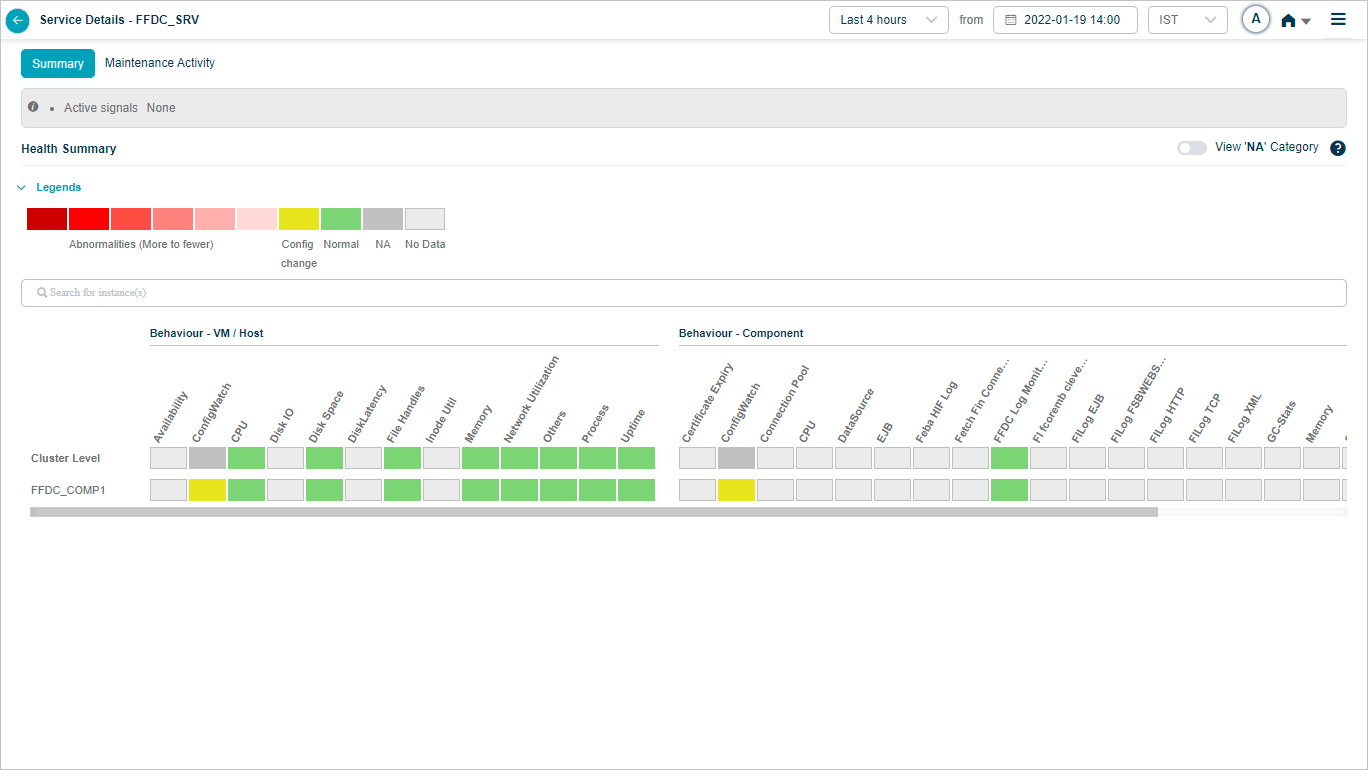
Overview heat map

1. Events are sorted from highest to lowest.
2 and 3. Instances and KPI categories are listed alphabetically. If the service has host instances only, the heat map shows only those (with cluster on top) and you will see “No component instance is mapped to this service”. Instances with events come before instances without.
4. Each block is one category for one instance or cluster.
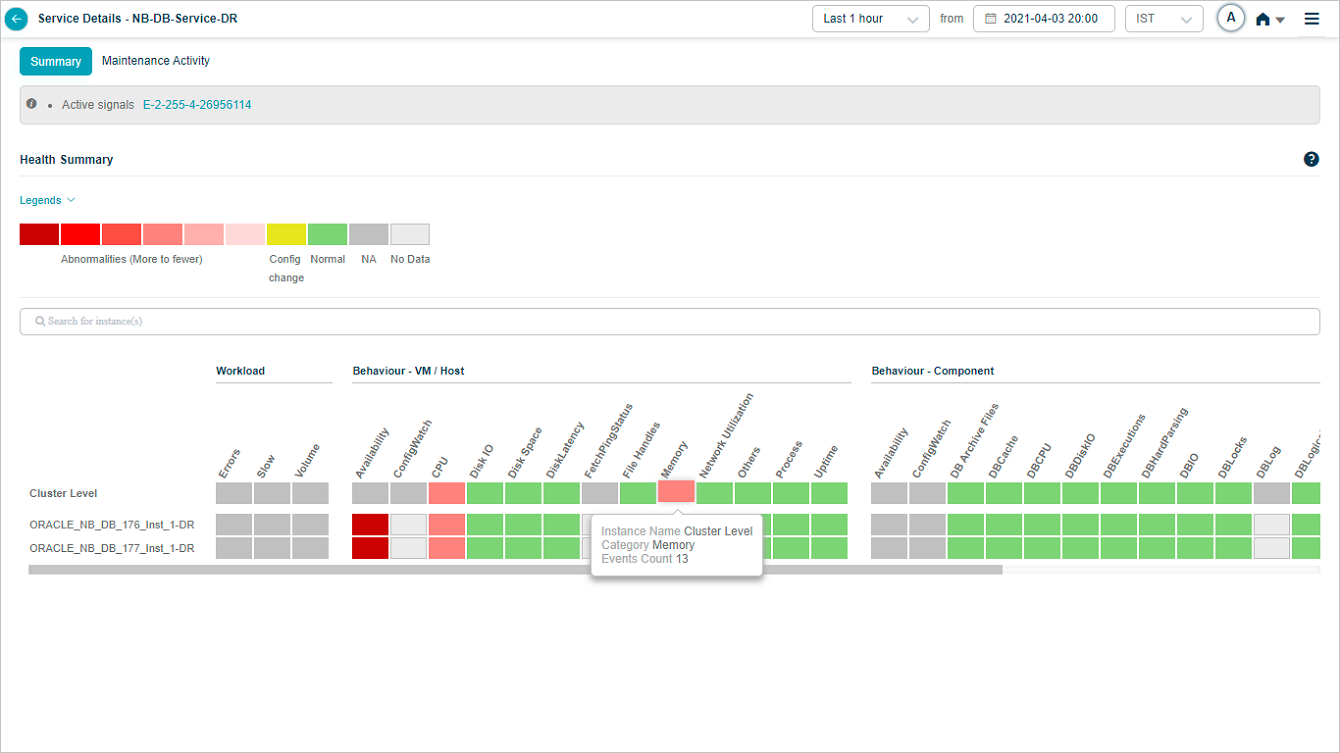
5. Hover any block to see the event count for the KPI category at that instance or cluster level. Gray blocks mean the category is not applicable at that level.
6. The default time window is the last 1 hour.
7. Active problems are shown as a comma-separated list.
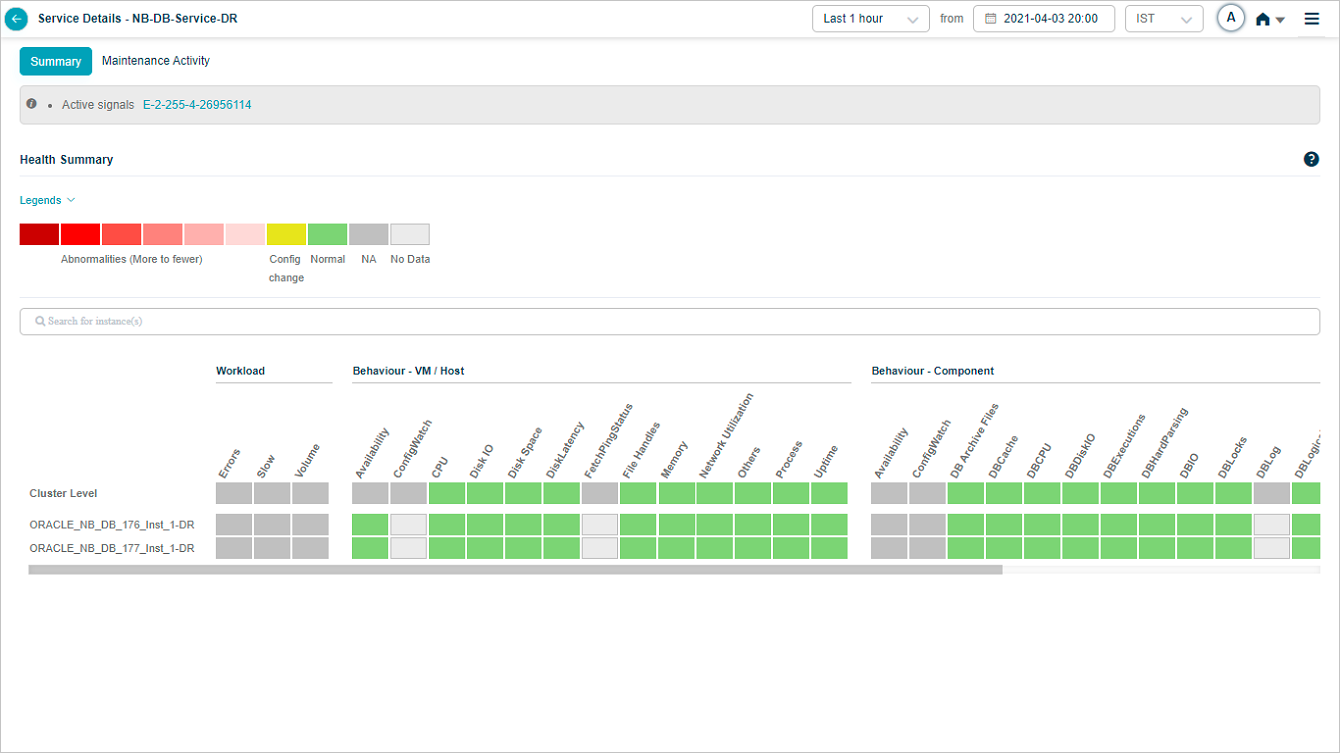
Service Details with no events:
Hover on a block with events at cluster level:
Hover on a block with events at instance level:

Hover a component instance to see the host’s IP address:

Click the help icon to see in-screen information about the service details:

No data for the selected time range:

Scroll across when there are more instances than fit on the screen:
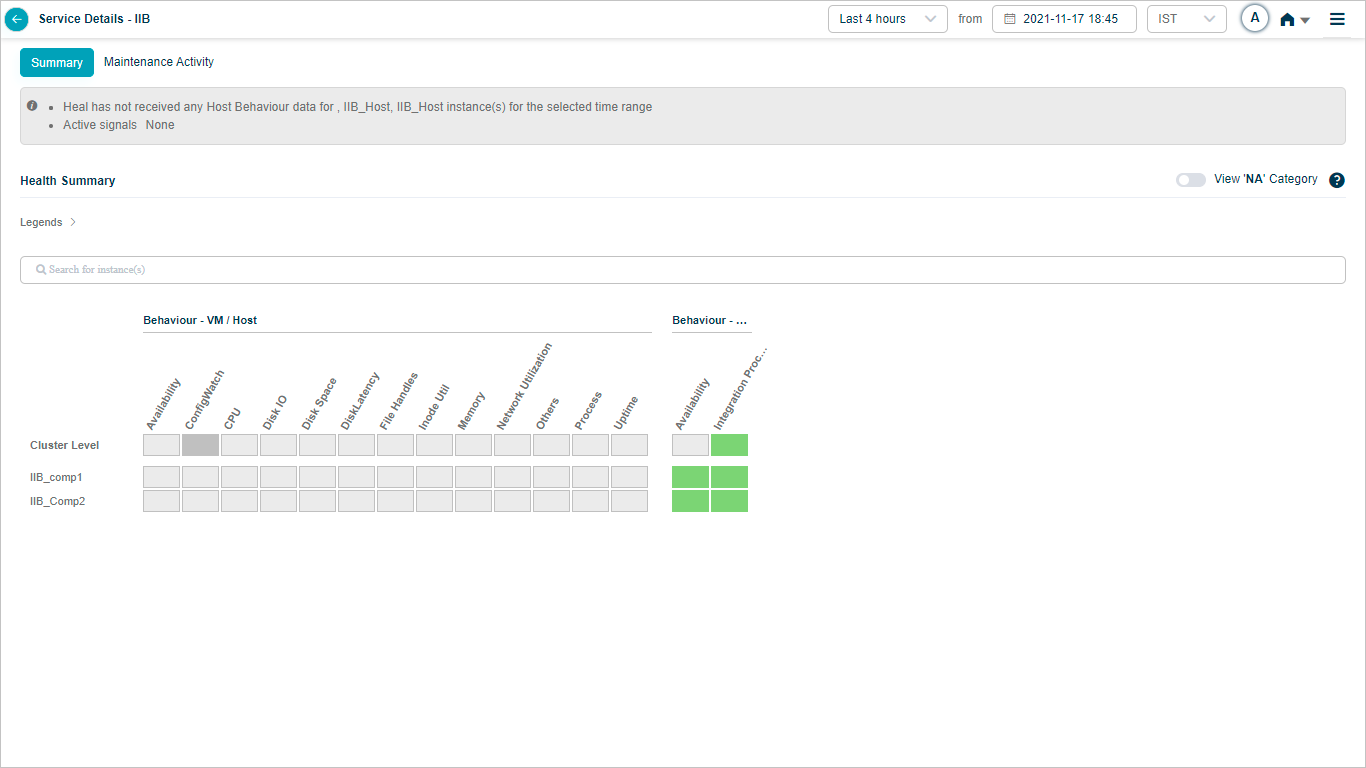
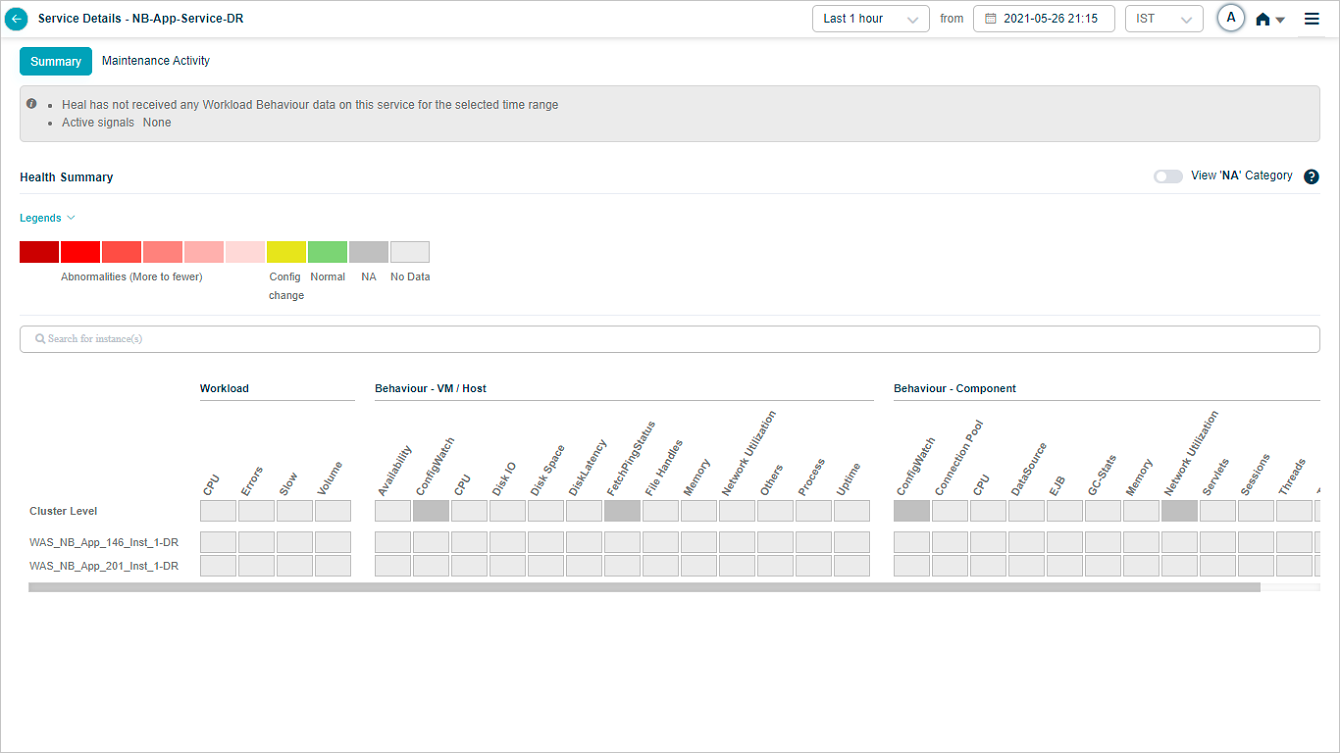
Show or hide NA categories
NA categories are hidden by default. Switch the slider to ON to see every category at cluster and instance level even when its KPIs are NA.
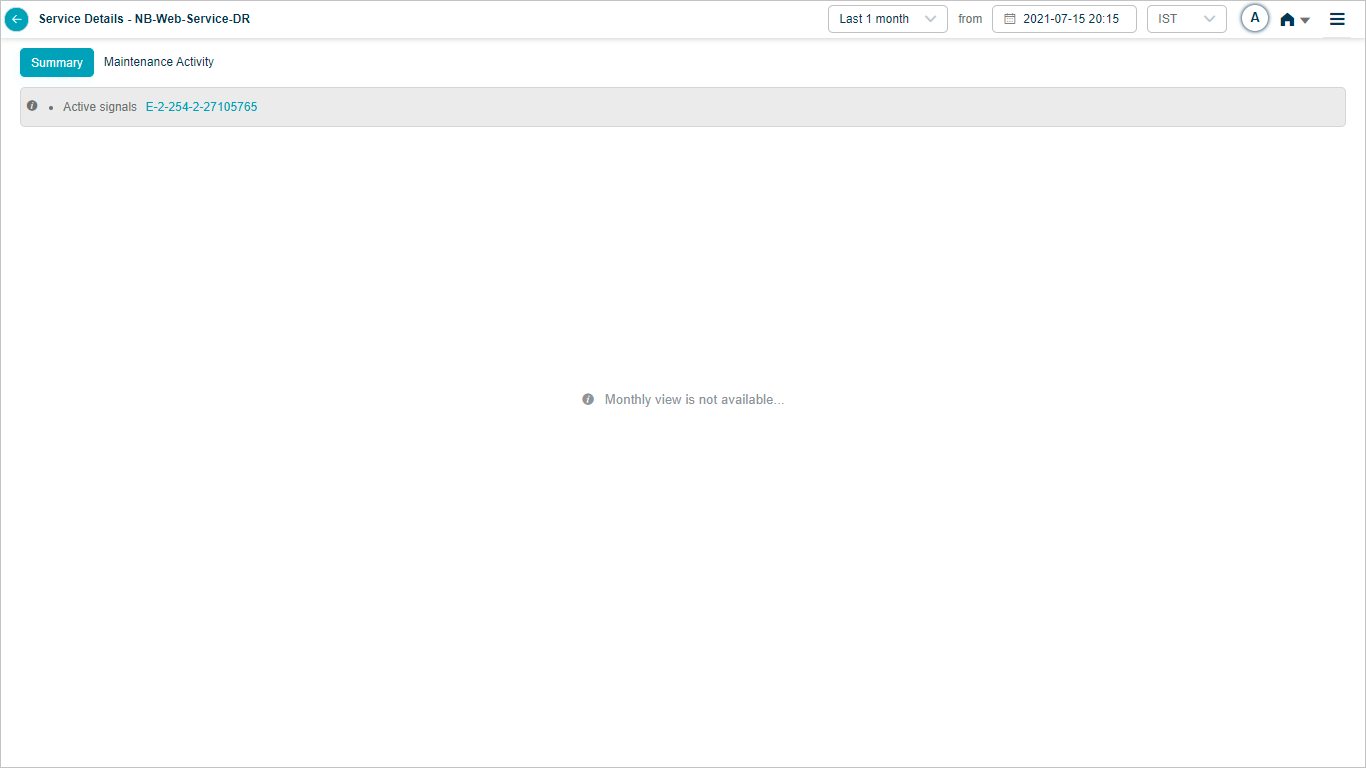
Monthly heat map data
If you select Last 1 month in the duration box, HEAL does not render heat map data for that range. You will see this message instead.
Search for instances
When the service has many instances, use the search box to filter to one or more.
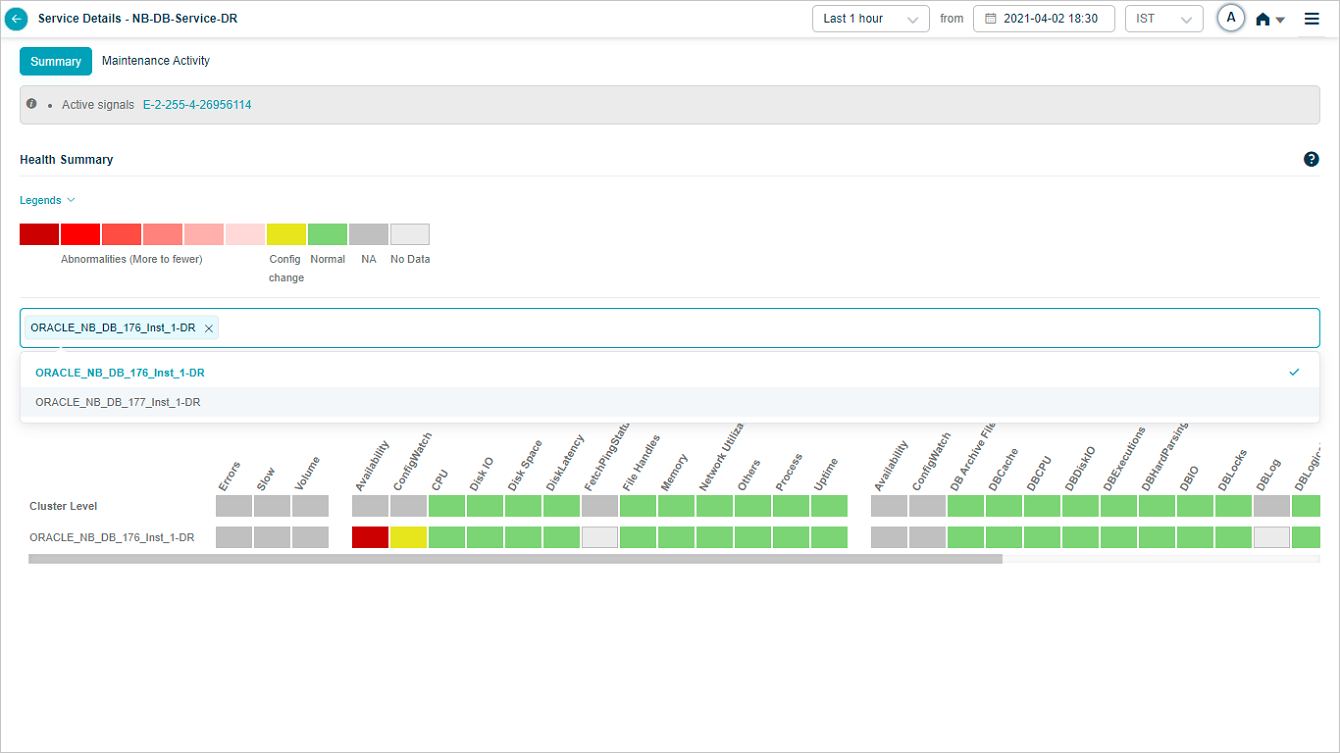
After you pick instances, the heat map narrows to those.

Service maintenance details
When a service is under maintenance, HEAL still collects and stores data, but does not run SOR or NOR or generate signals. Heat map blocks are green when no events occur and data is available, light gray when no data is collected.
If a Signal is open just before a maintenance window starts, it closes only when every service in the Signal is under maintenance. If only one of the services in a multi-service Signal is under maintenance, the Signal stays open. When you pick a time range that falls inside a maintenance window, the Summary section shows the UM icon.
The Service Details screen lists host and component instances under Cluster Level. Component instances may belong to different hosts, or several may share the same host.
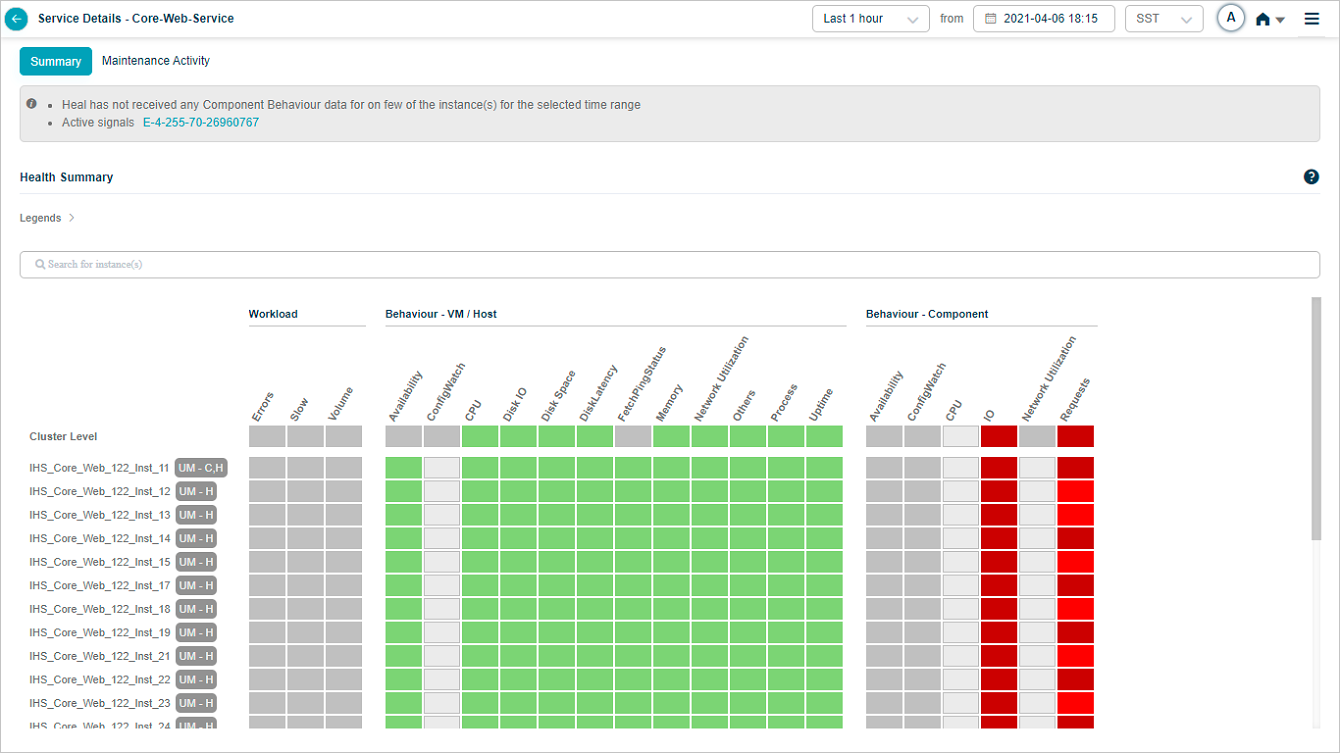
UM-C. A specific component instance is under maintenance.
UM-H. A specific host instance is under maintenance.
UM-C,H. The host and every component instance running on it are under maintenance.
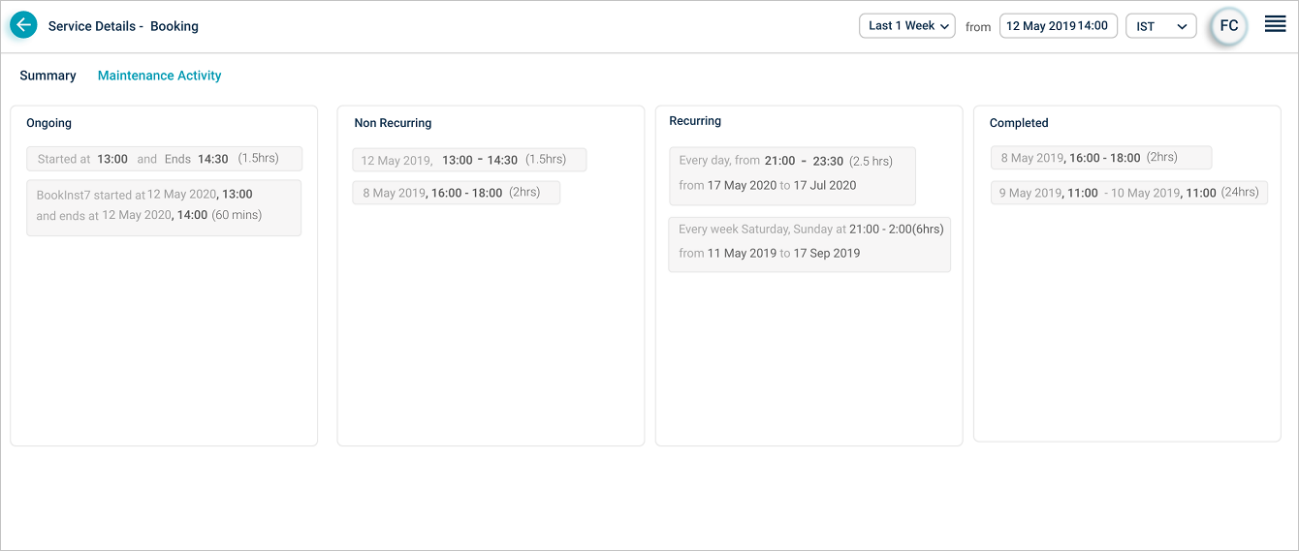
A service can have multiple maintenance windows. The Maintenance Activity section groups them as:
- Ongoing. The current active window.
- Non-Recurring. One-time maintenance dates.
- Recurring. Daily, weekly, or monthly patterns.
- Completed. Past windows that have already finished.
Scheduled and ad hoc maintenance
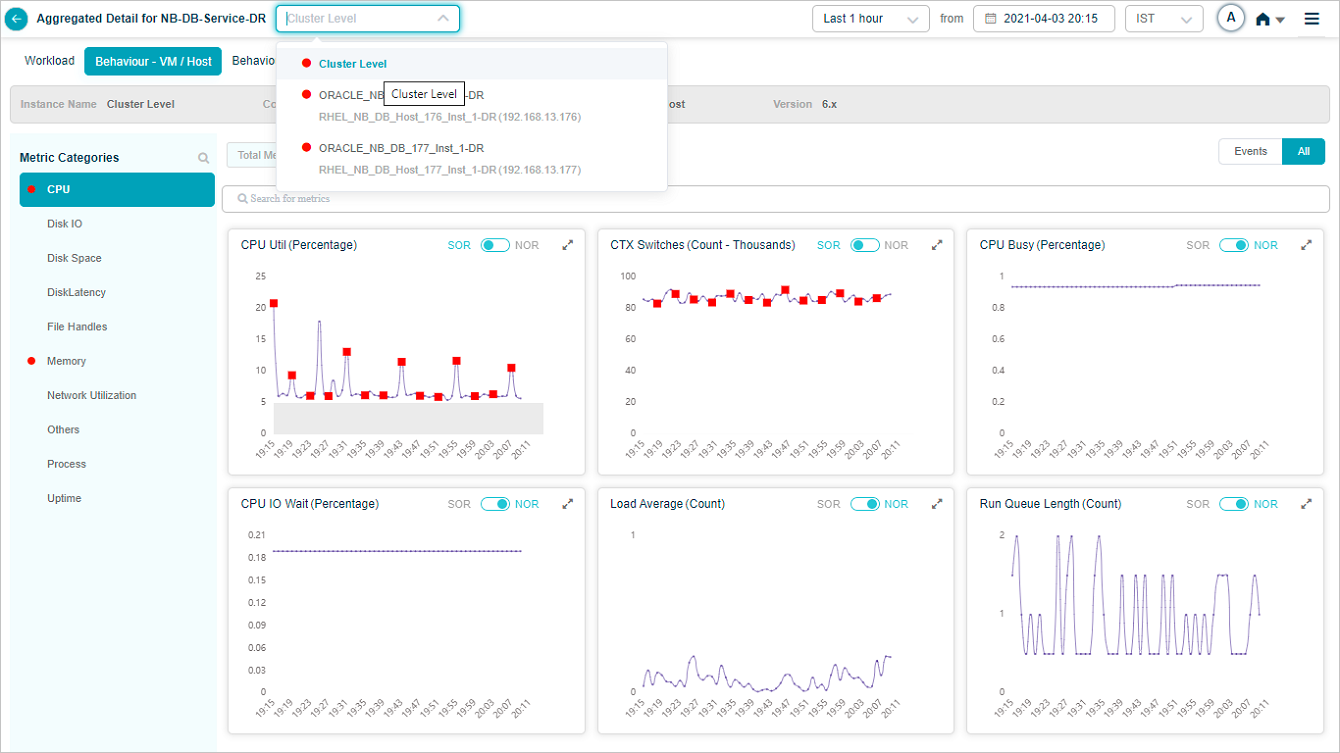
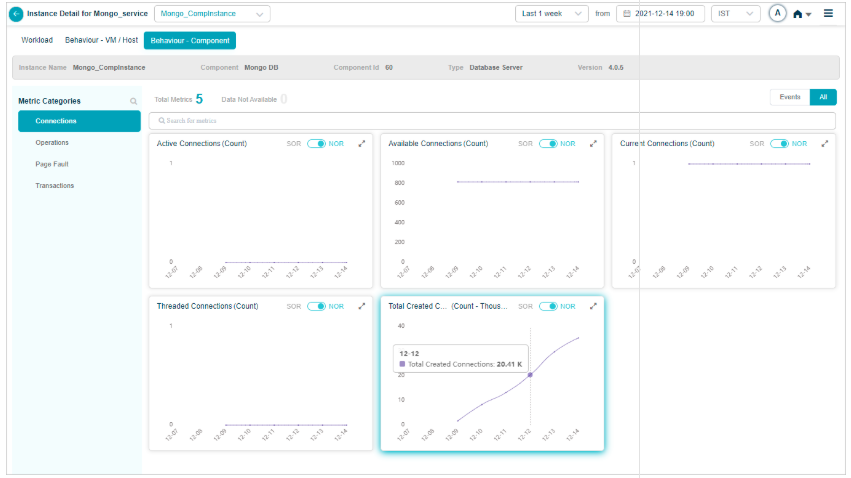
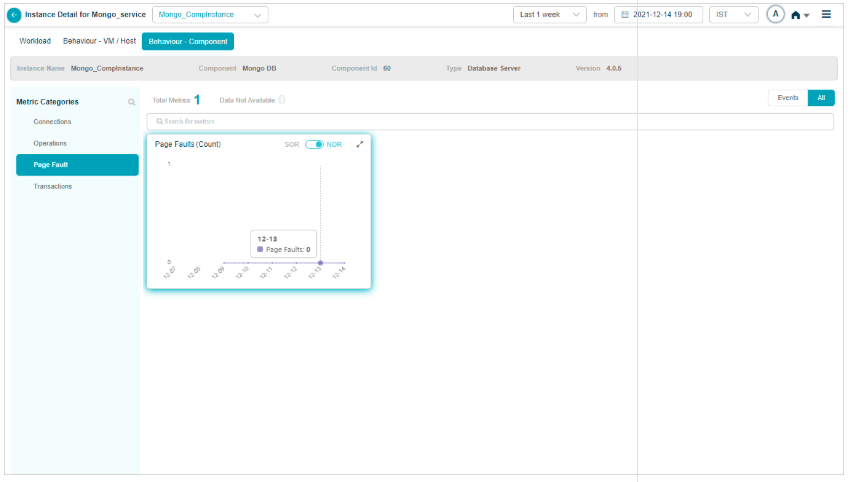
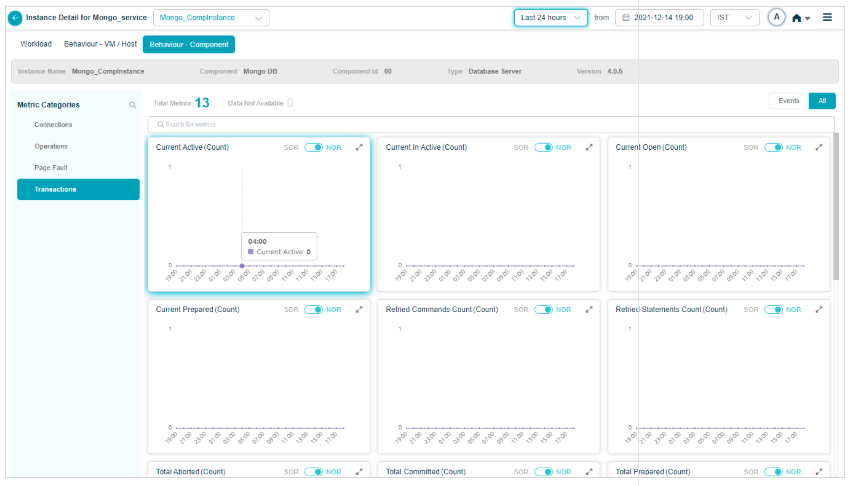
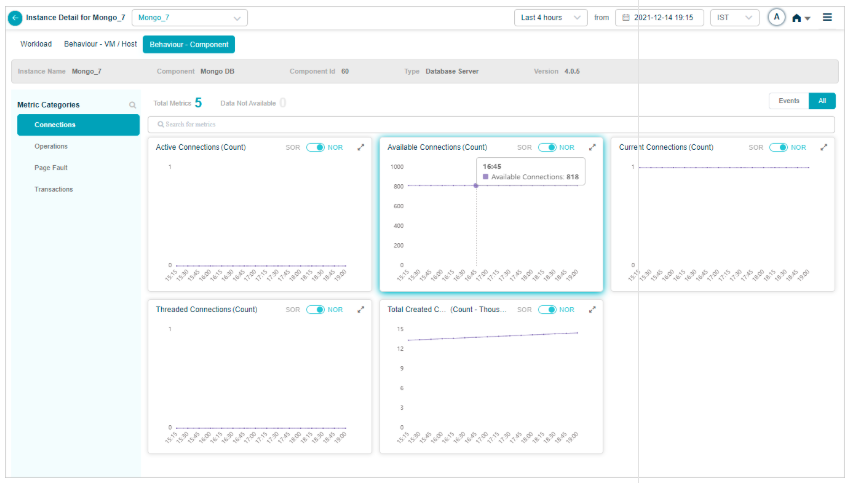
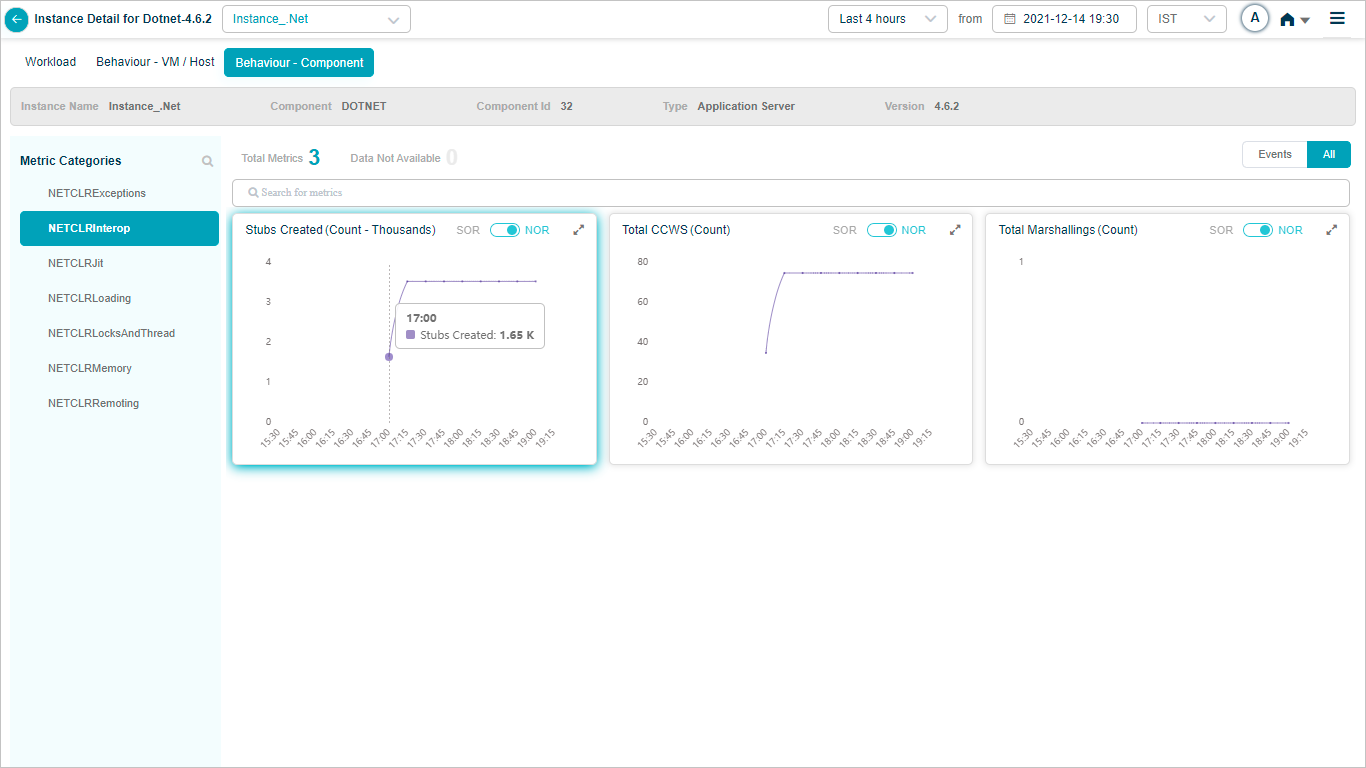
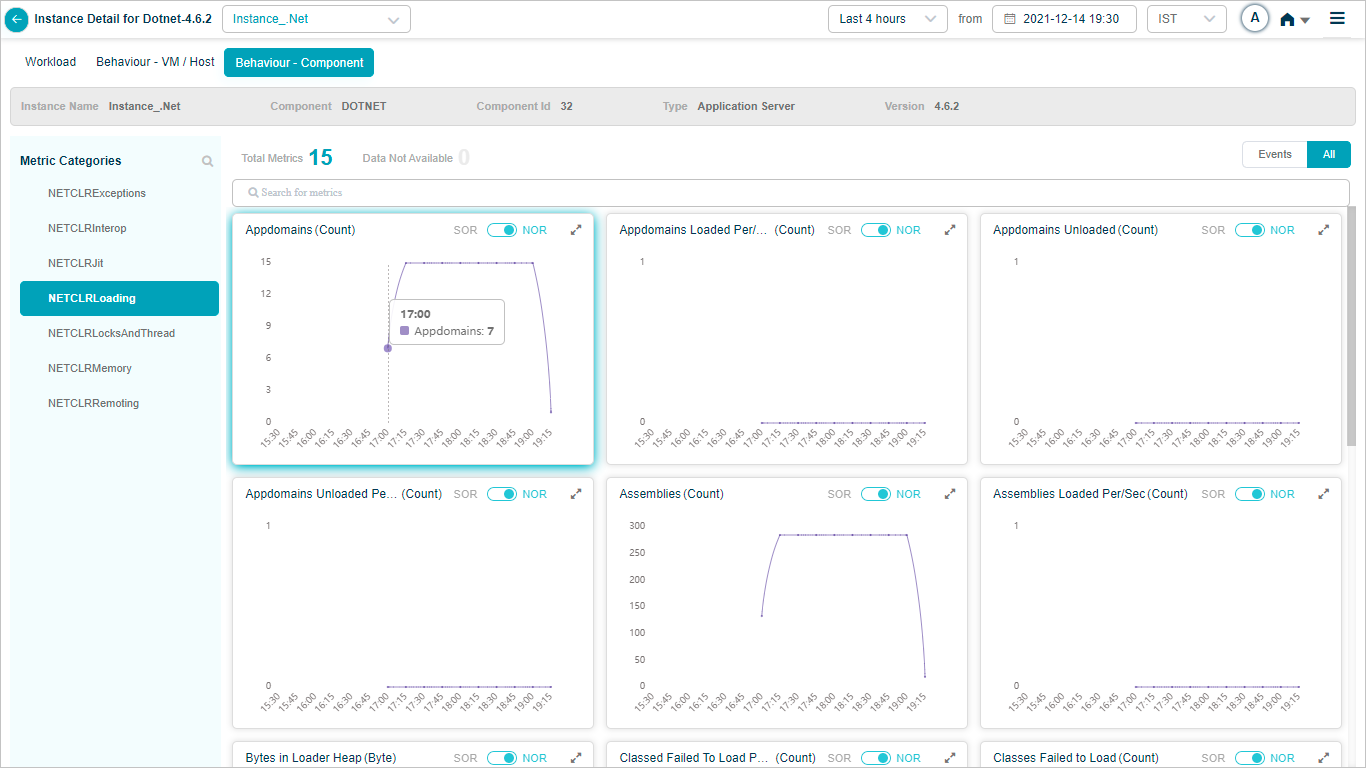
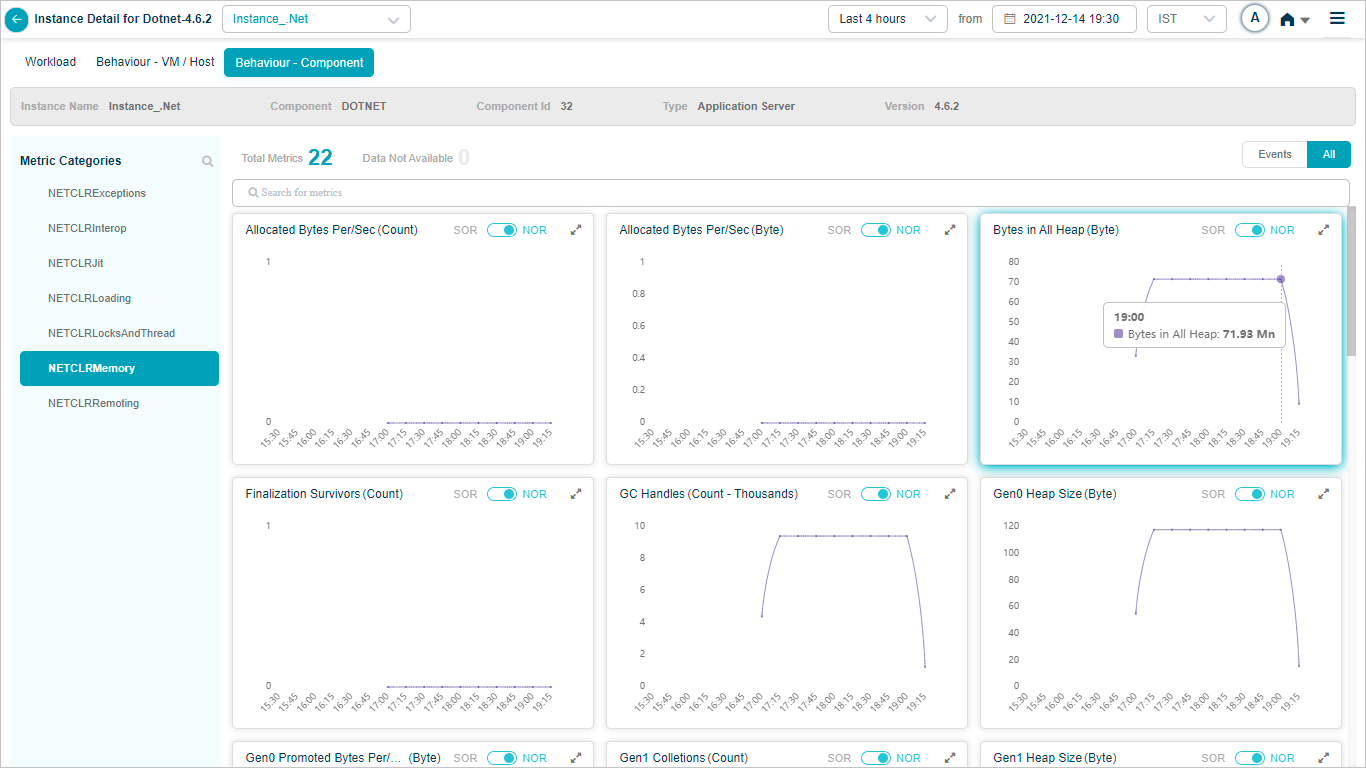
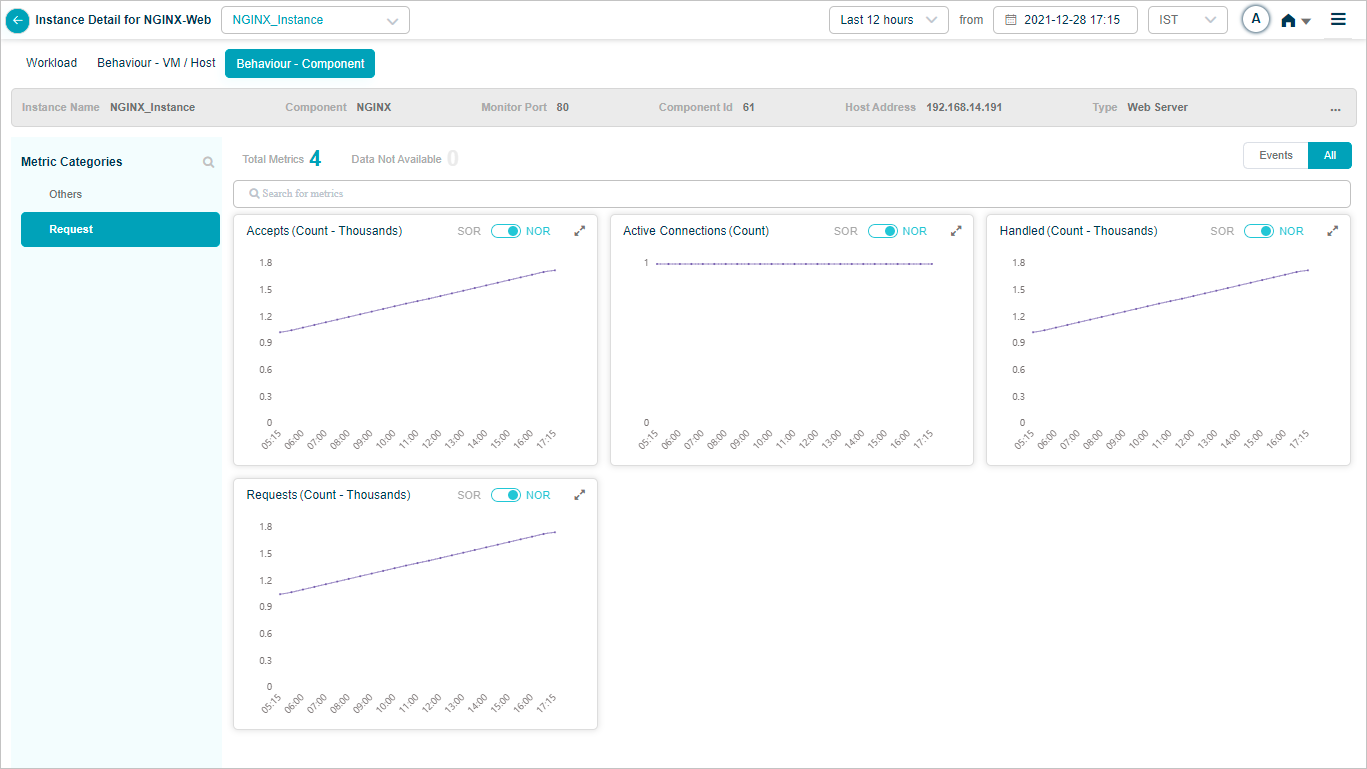
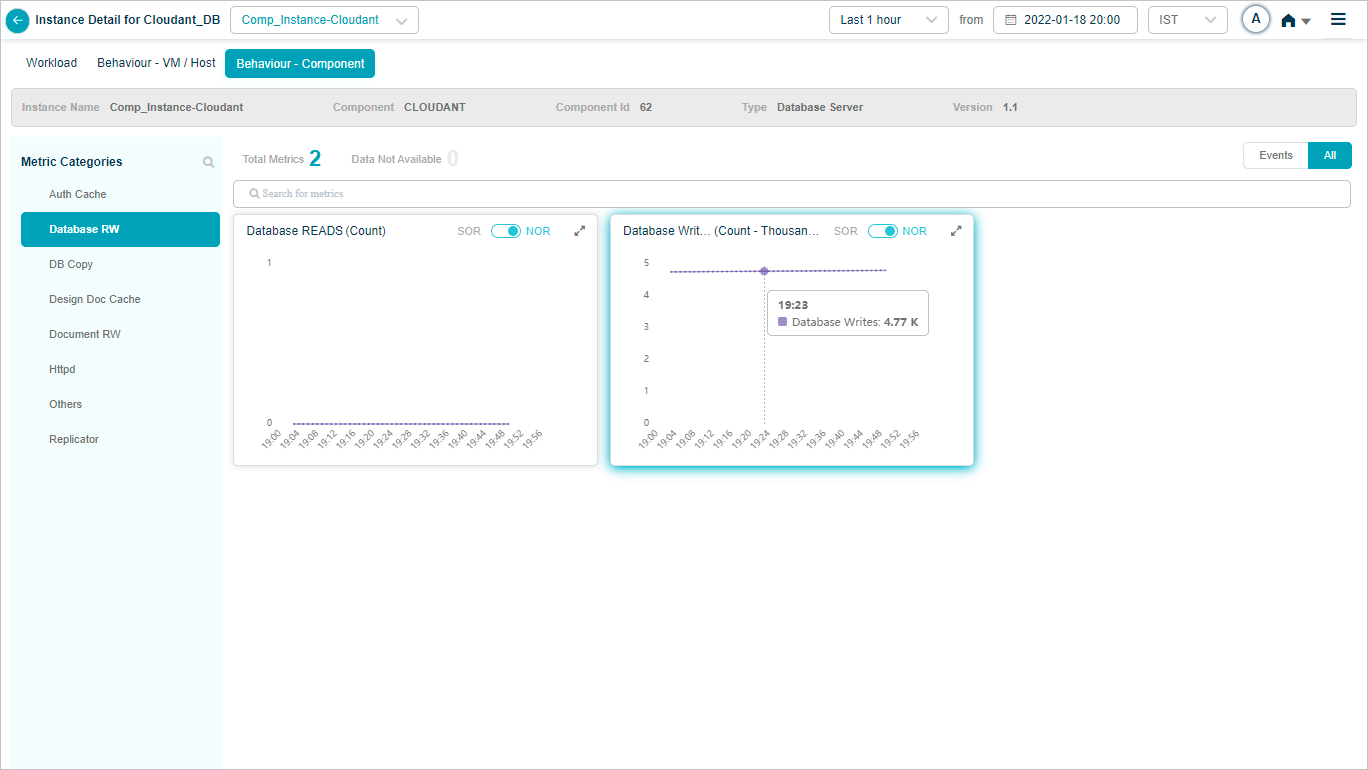
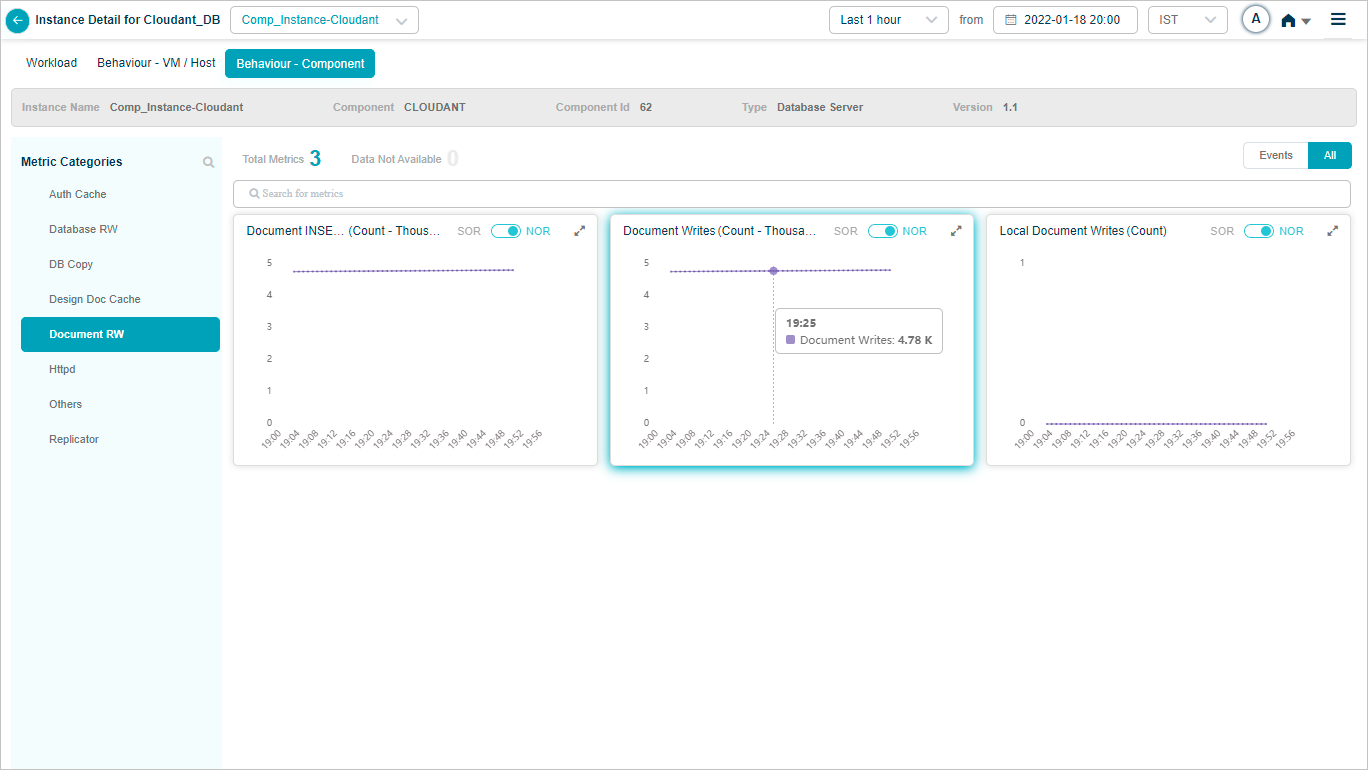
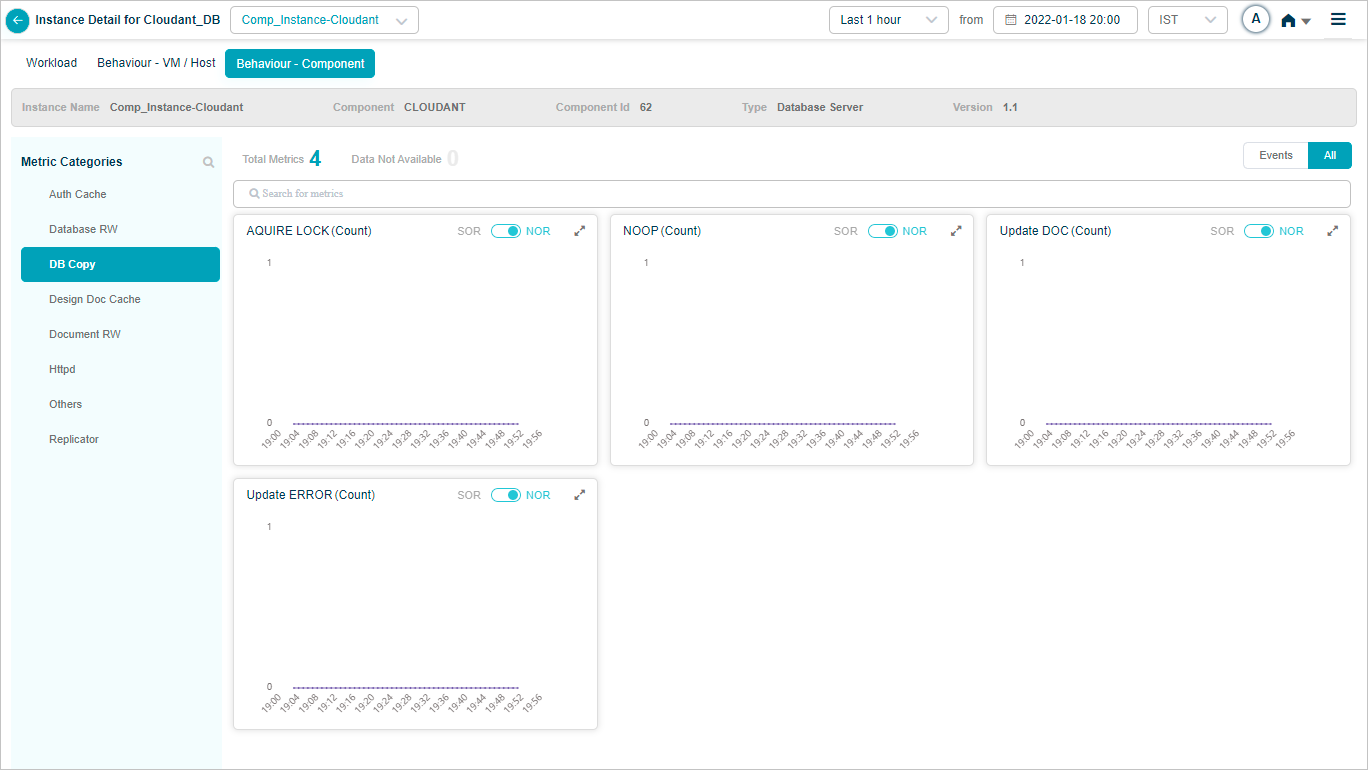
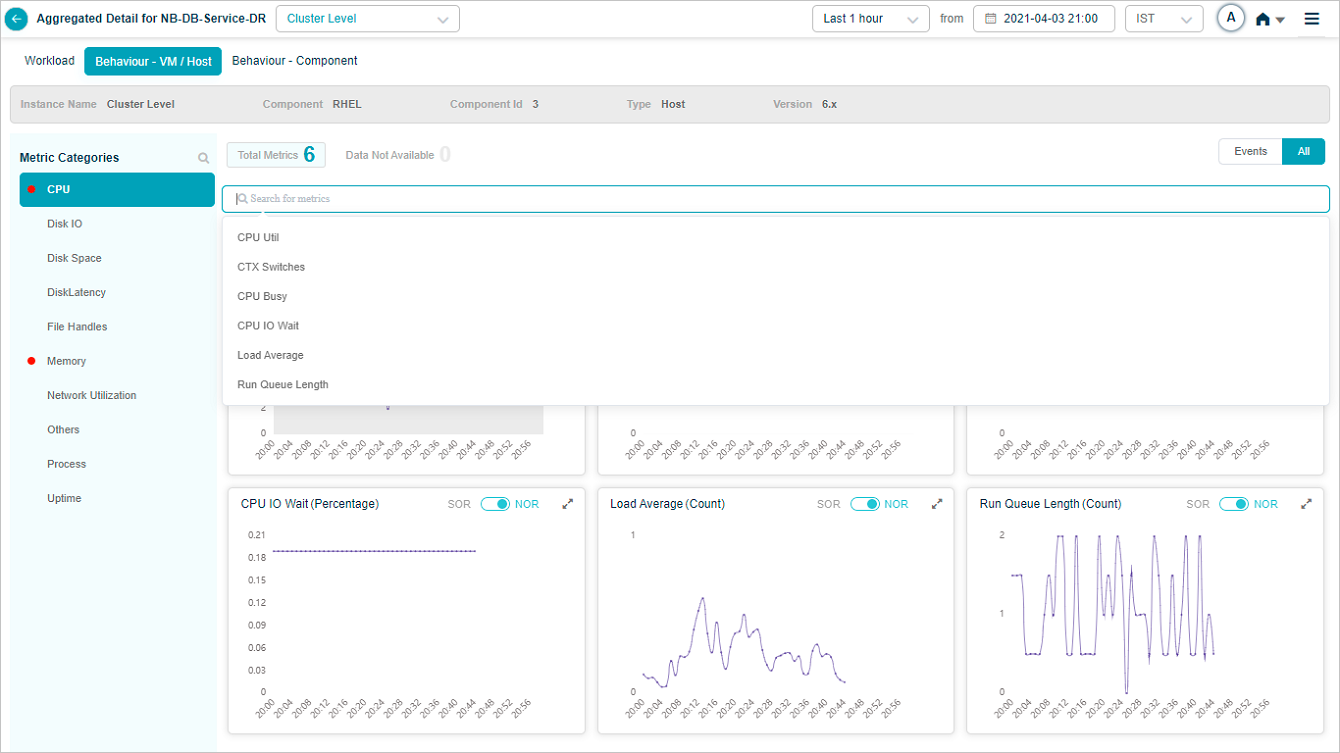
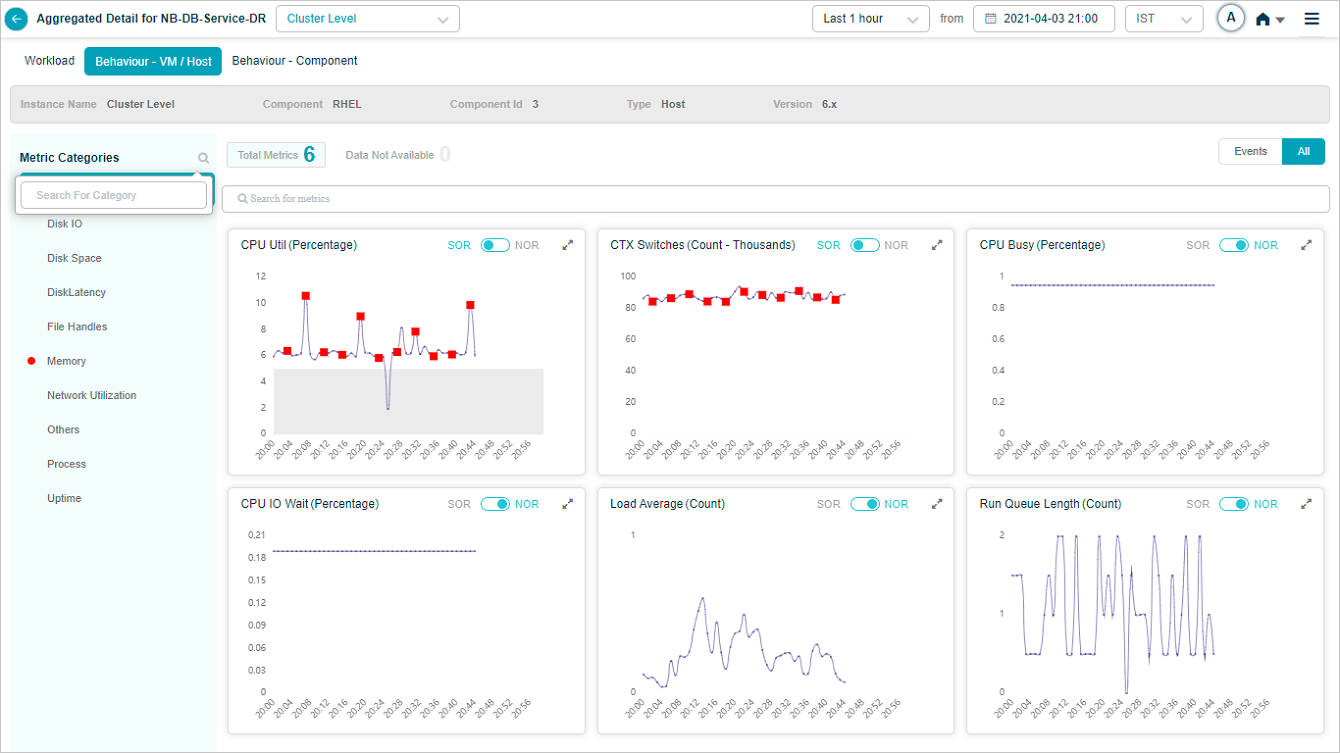
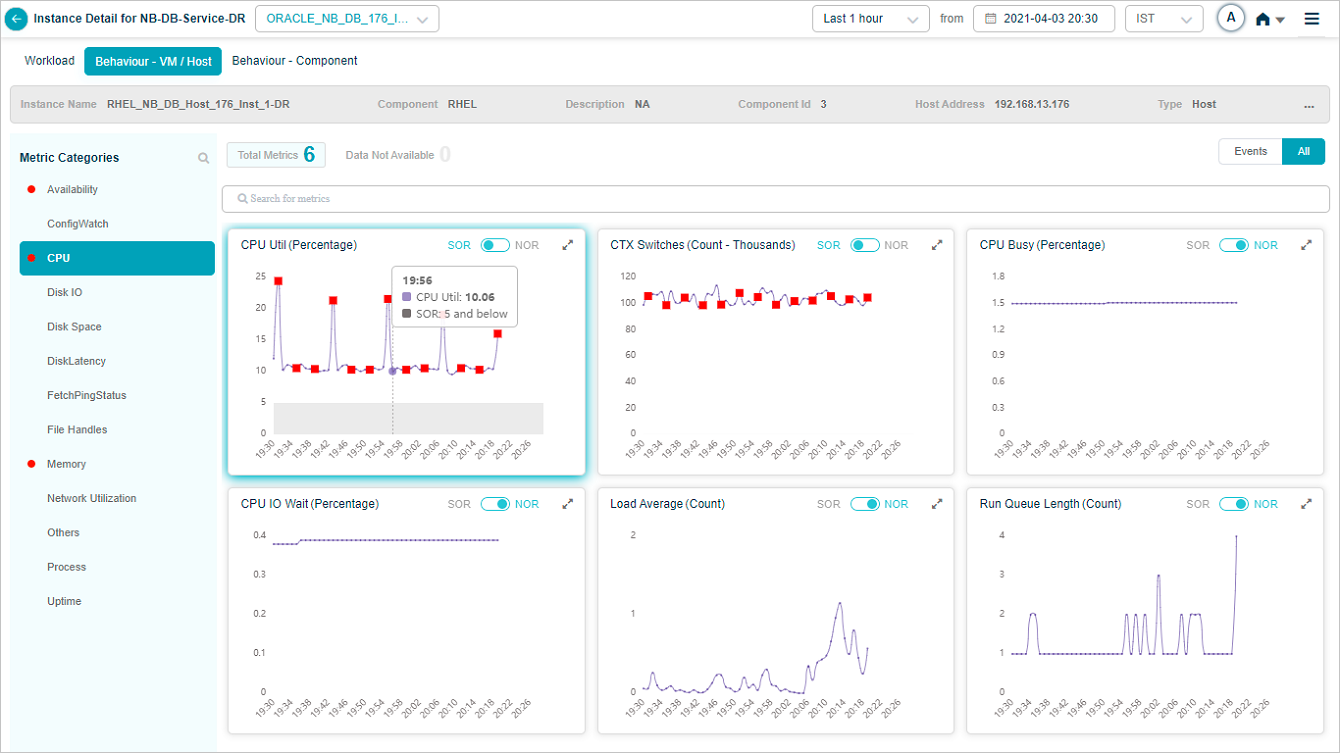
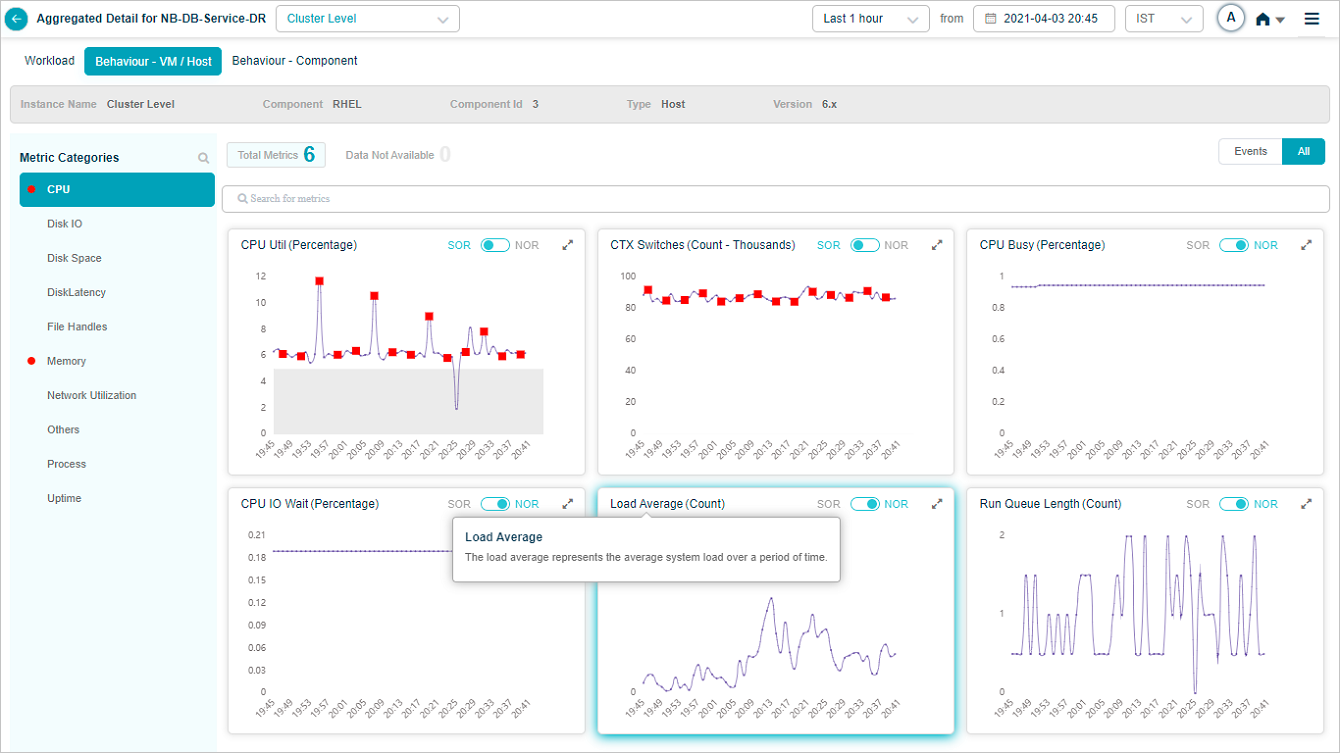
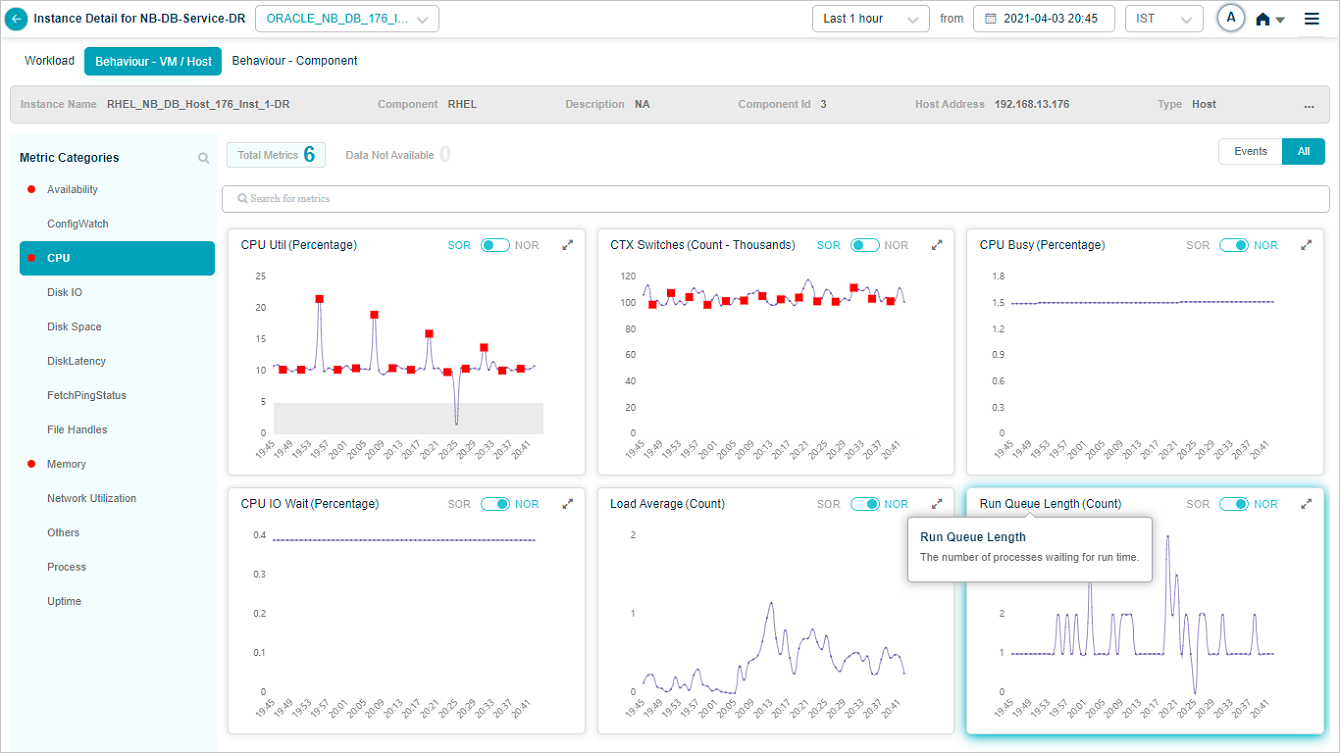
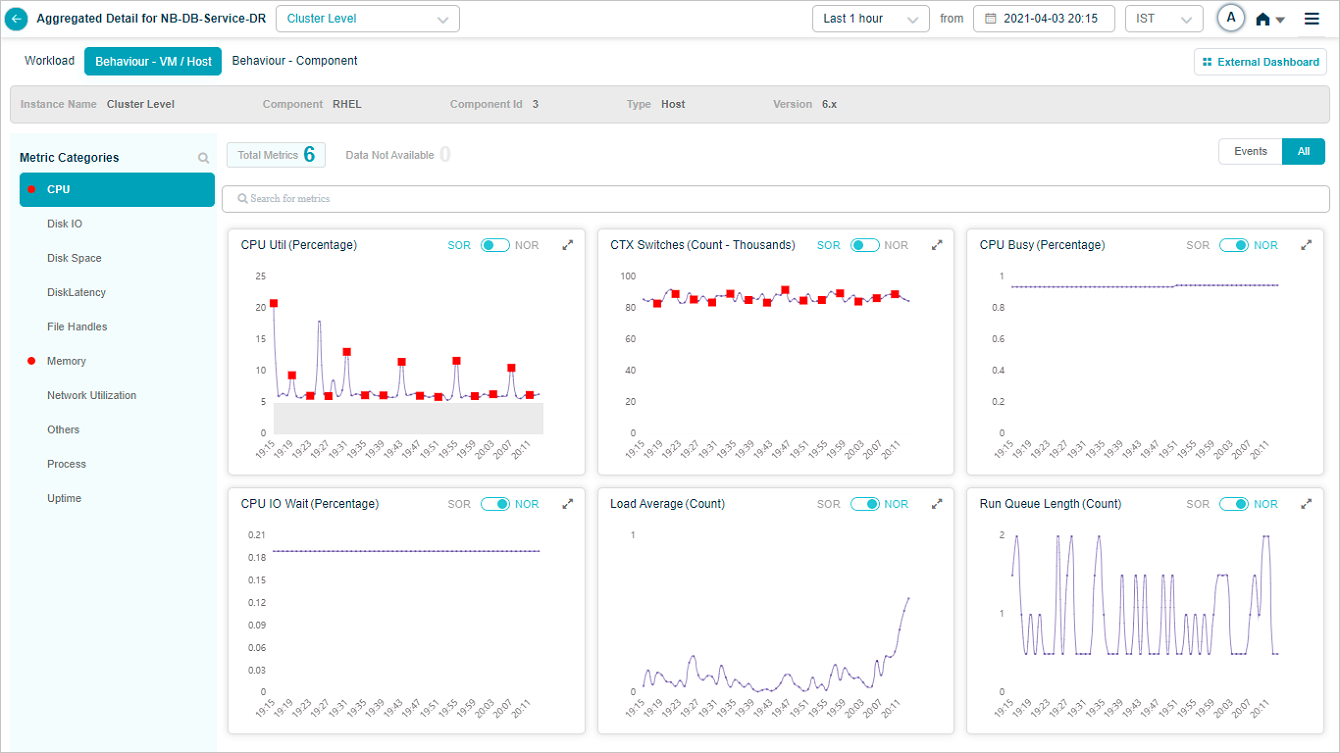
KPI data at cluster or instance level
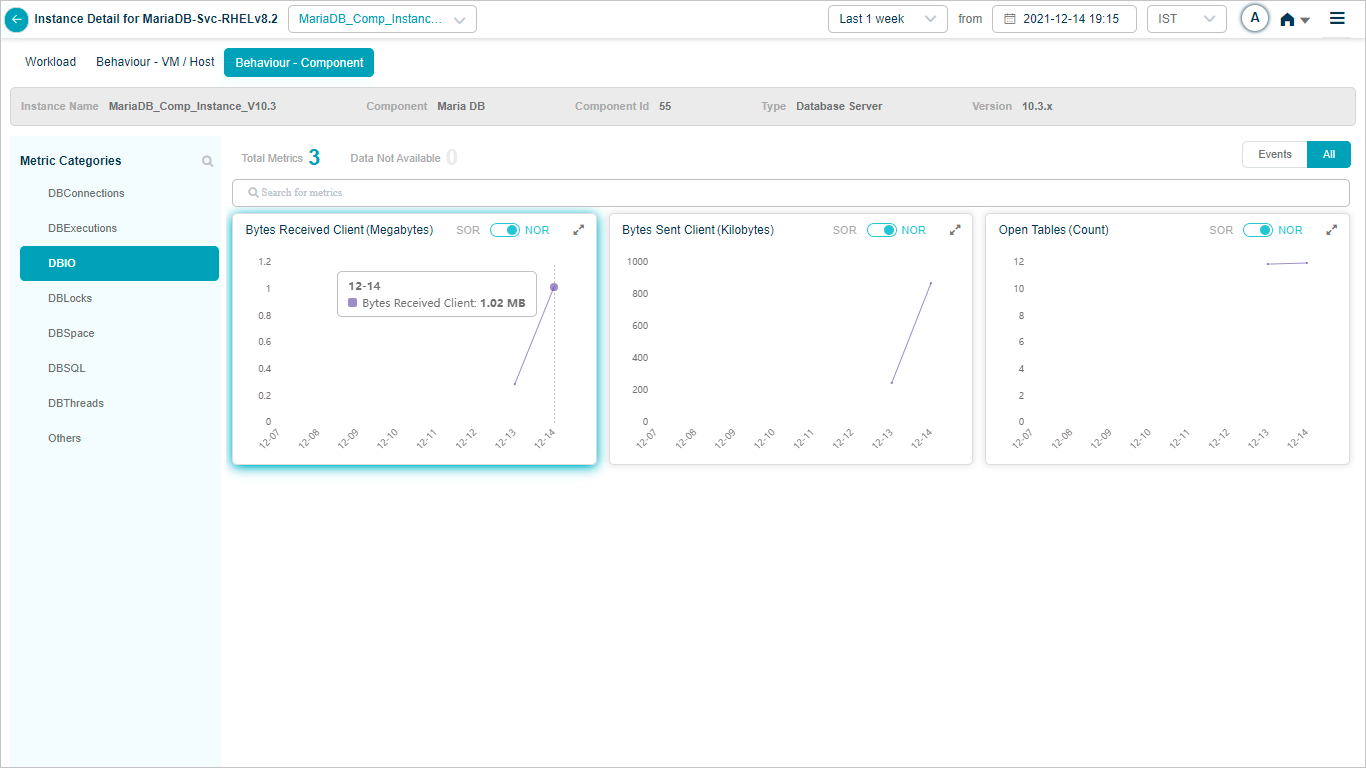
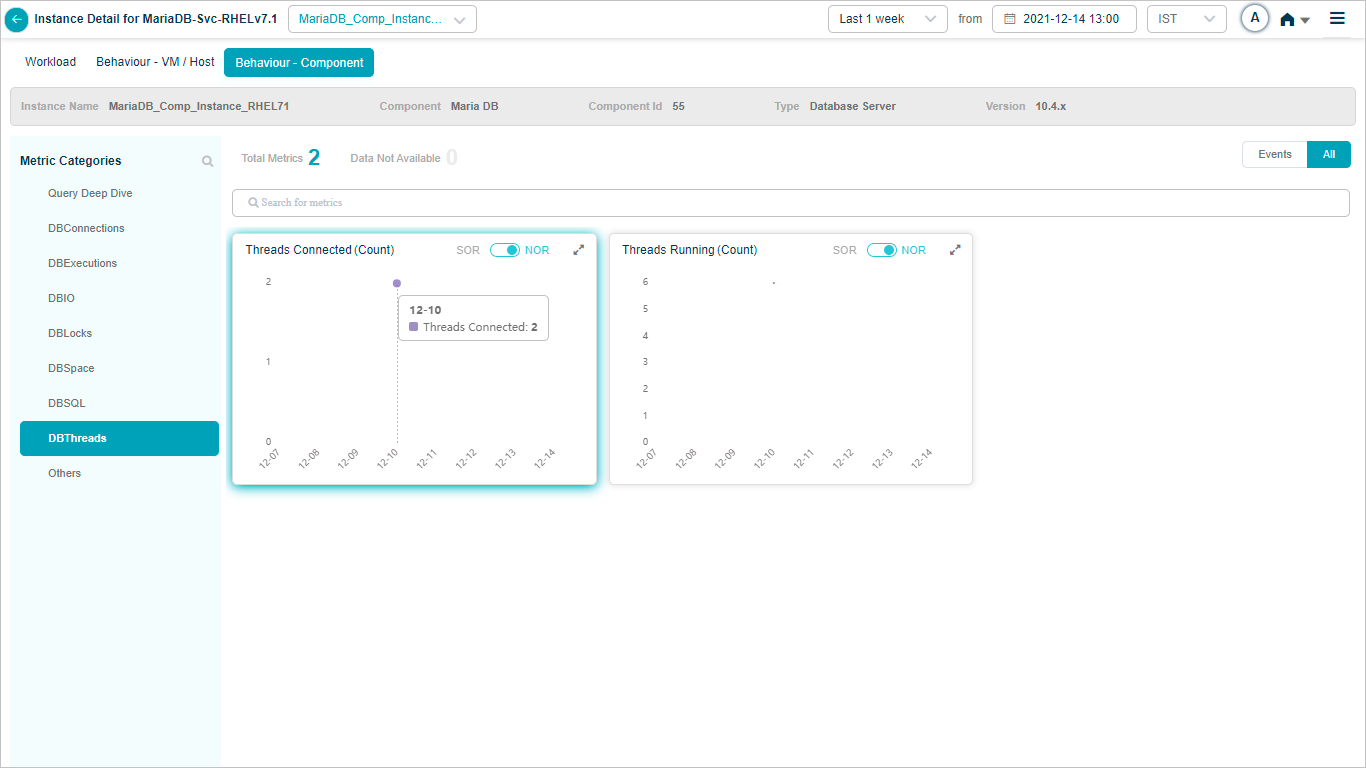
Click any KPI category in the overview heat map to see the metrics for that category. The dropdown next to the service name lists every instance, so you can switch between them.
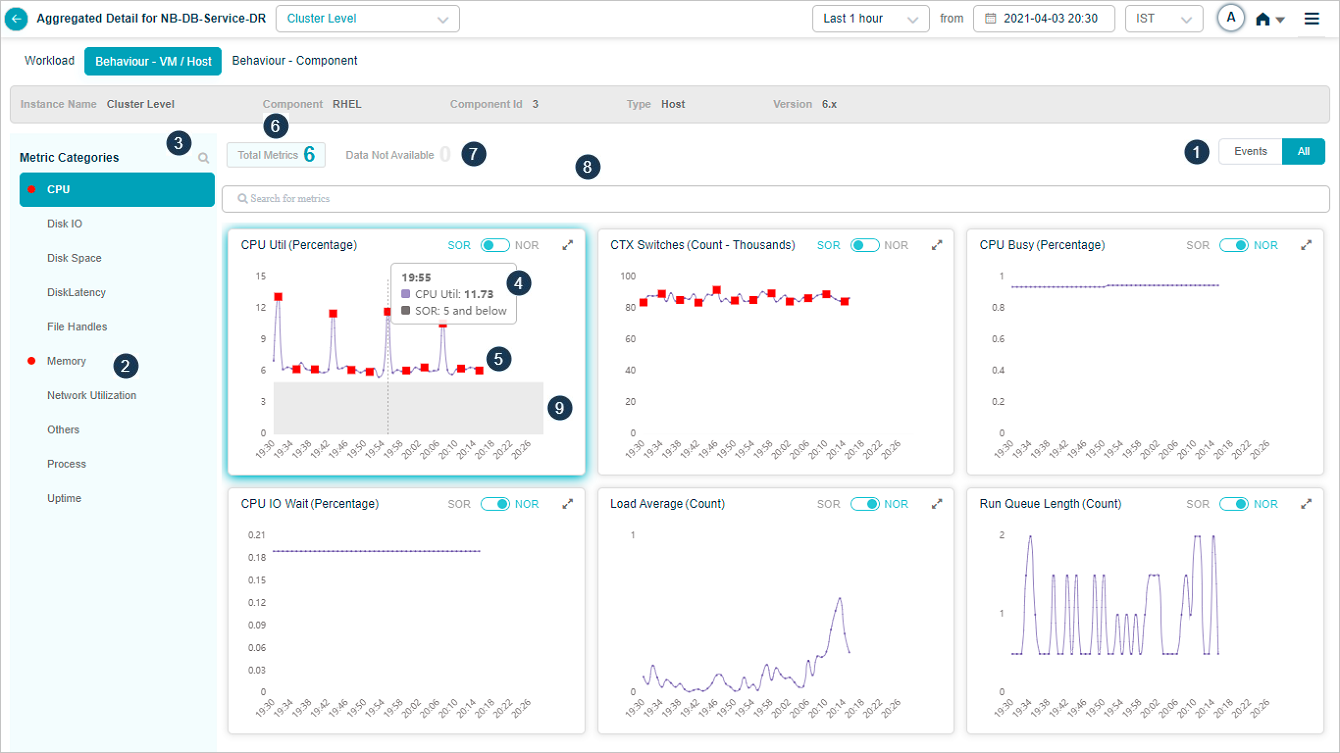

1. Events vs All. If a category has events, Events is selected by default. With no events, All is selected. KPIs with events are listed first.
2. Behavior metrics by category. A red circle next to a category name means it has at least one event. An amber circle on Config Watch means there are configuration changes.
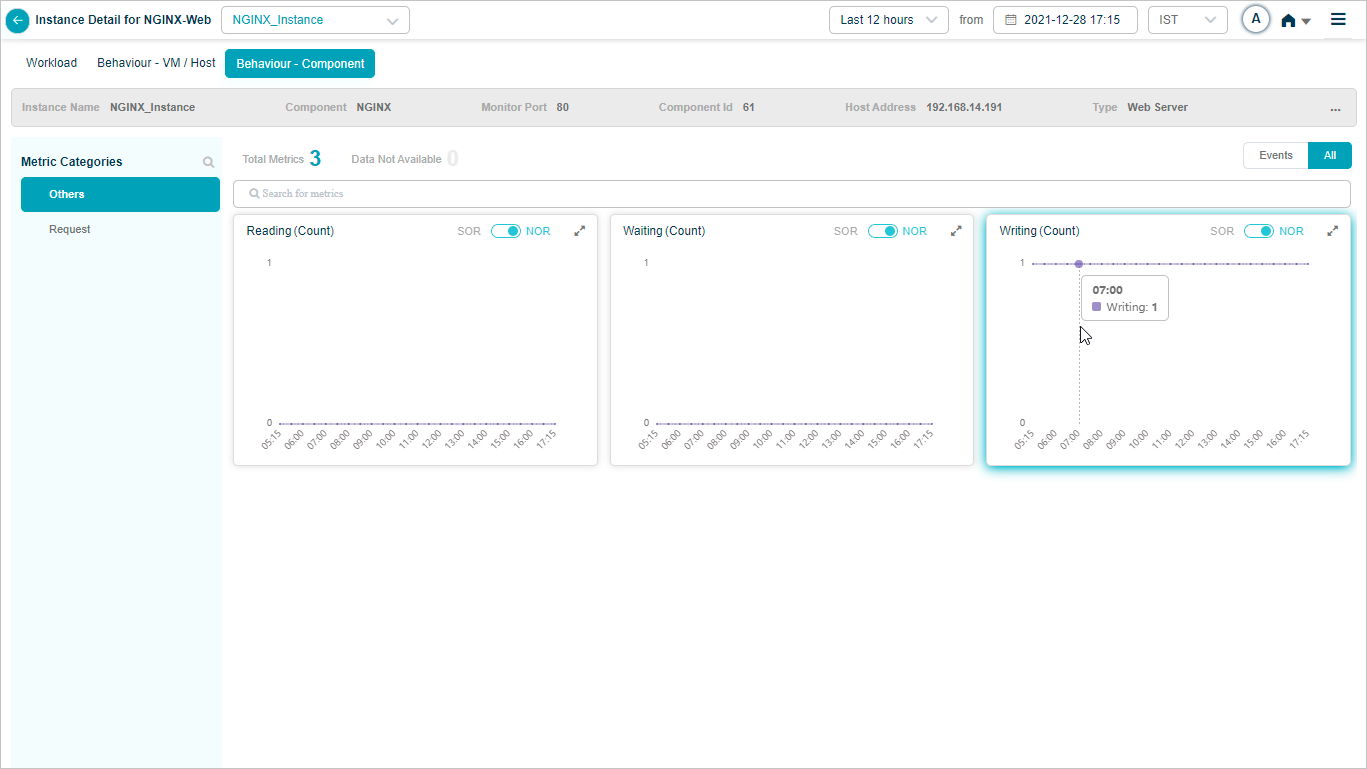
3. Category search. Find categories by name. KPIs that do not belong to any category land under Others.
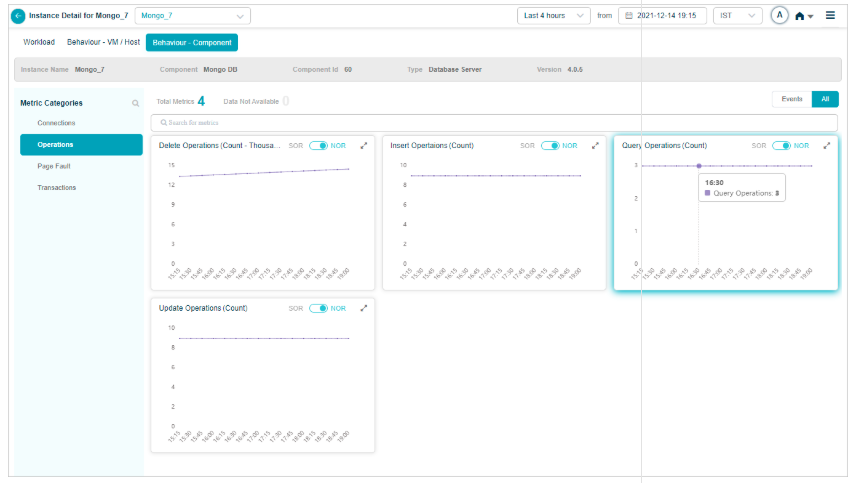
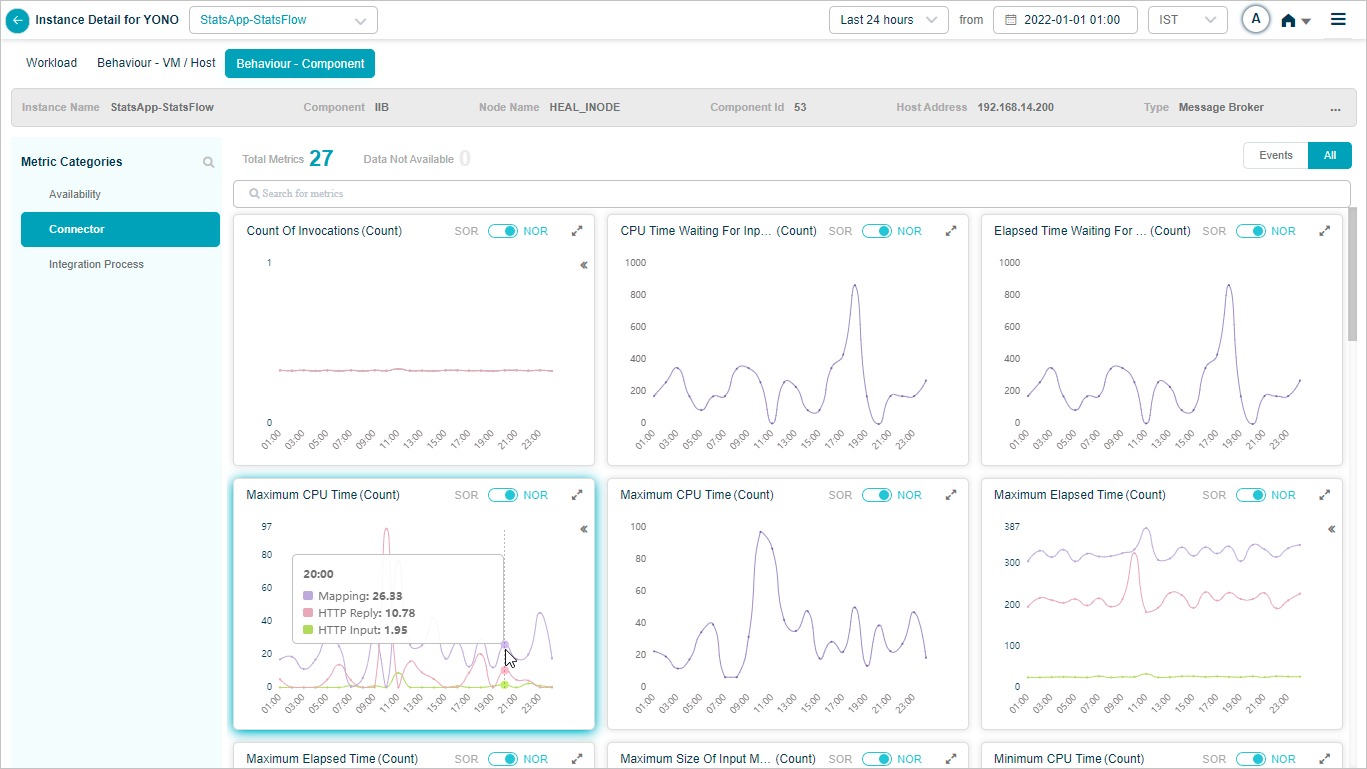
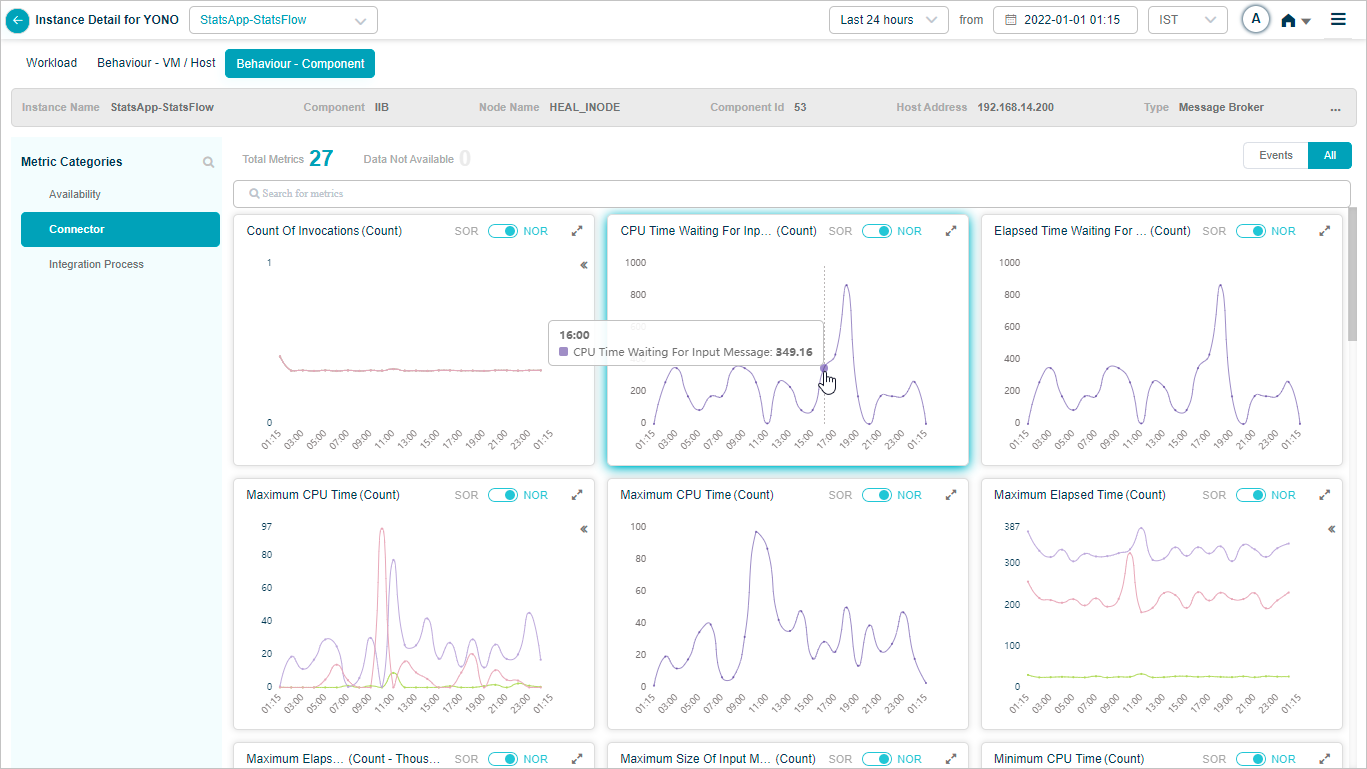
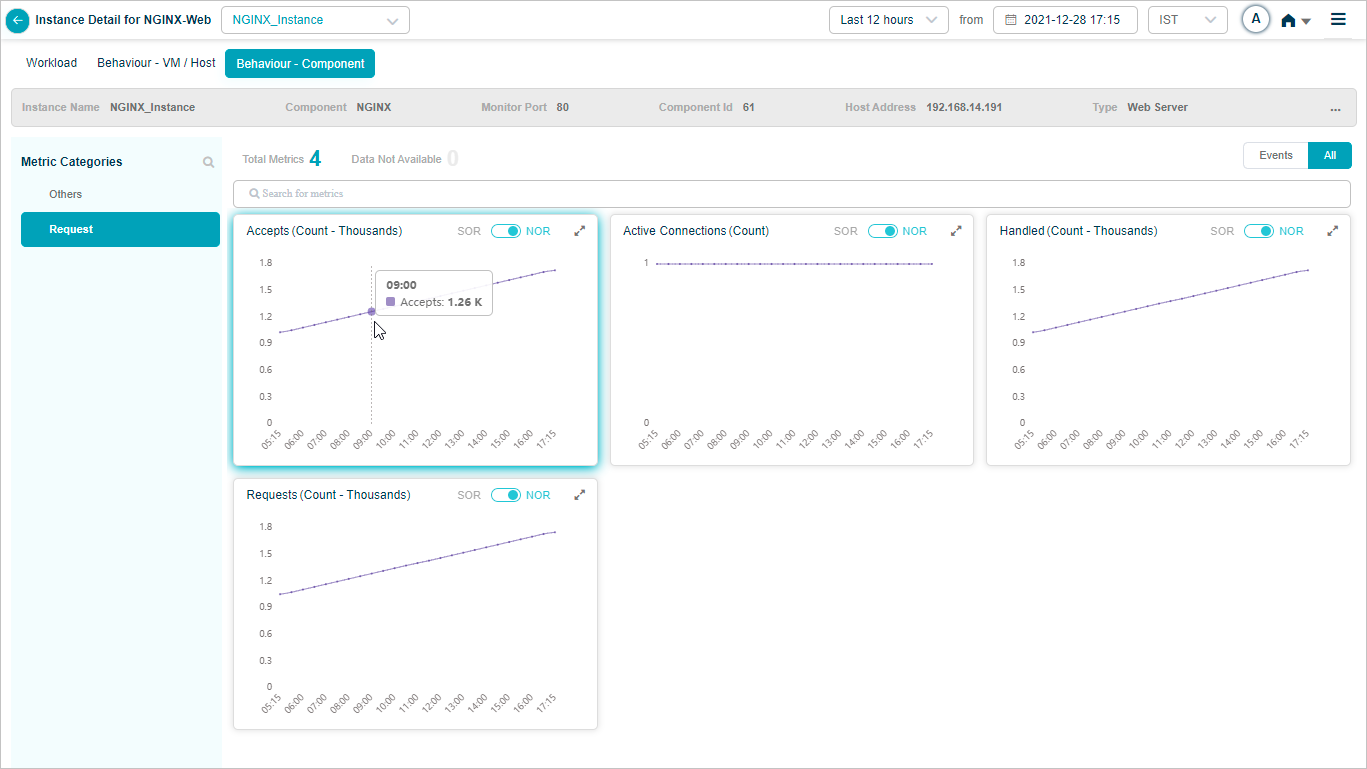
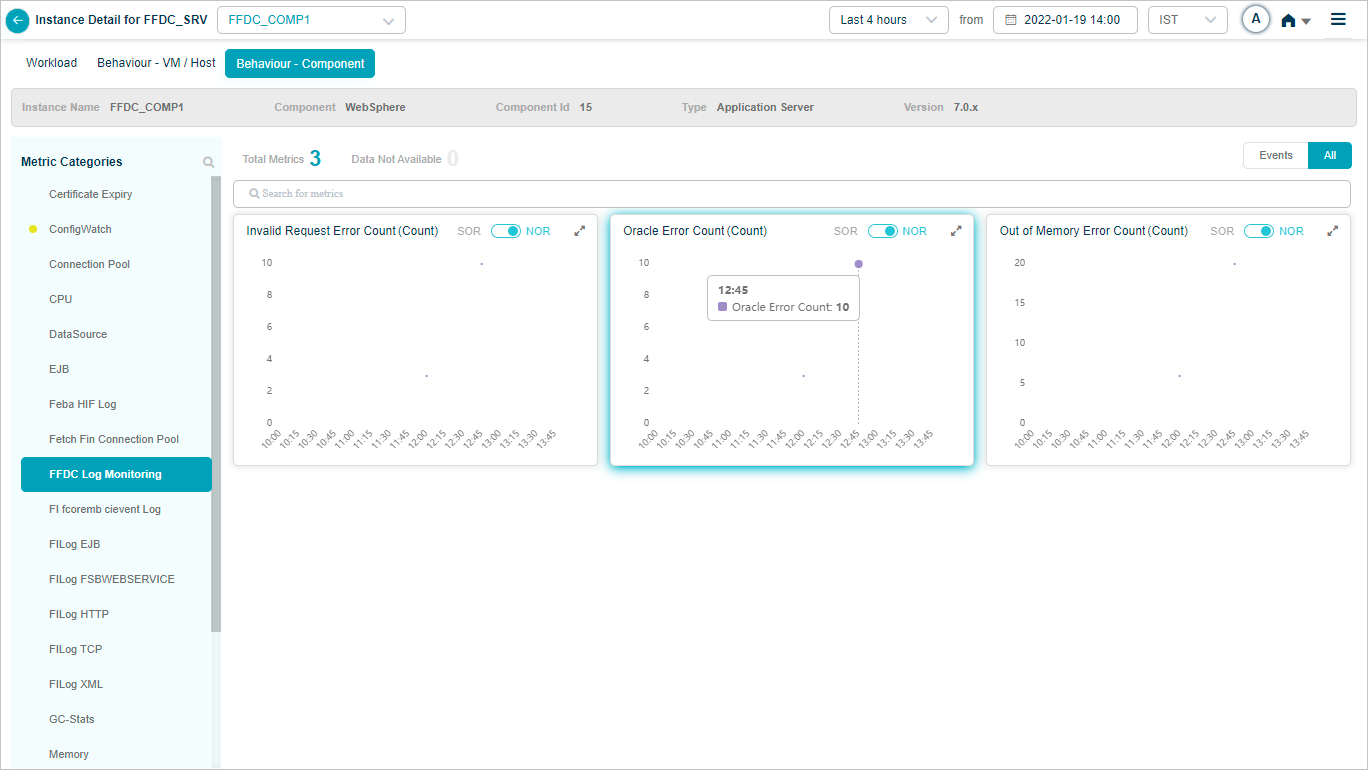
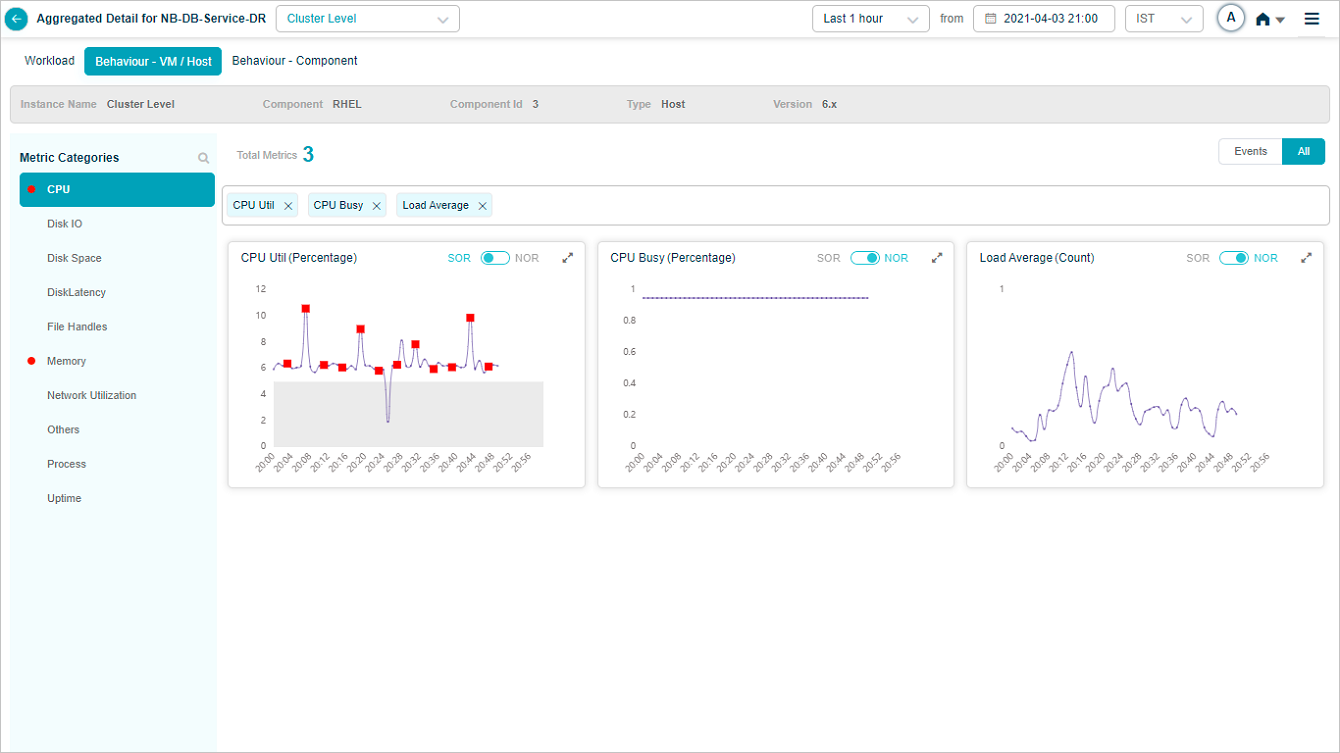
4. KPI value tooltip. Hover any dot to see the time, the KPI value, the NOR (set by the MLE), and the SOR (set by the admin in Control Center).
5. Event dots. Red dots are events. Hover for specifics.
6. Pods with data. Total pods in the category that have data.
7. Pods without data. Total pods in the category with no data.
8. KPI search. Find KPIs by name within the category.
9. NOR and SOR bands. Shown as gray bands. For Last 30 minutes and Last 1 hour you see minute-level data. Beyond an hour, data is rolled up (15-minute roll-up at Last 4 hours, 1-hour roll-up at Last 24 hours), and the bands are hidden even though events still appear. When both NOR and SOR are available, NOR is selected by default and you can switch with the slider. When only one is available, the slider locks to that option.
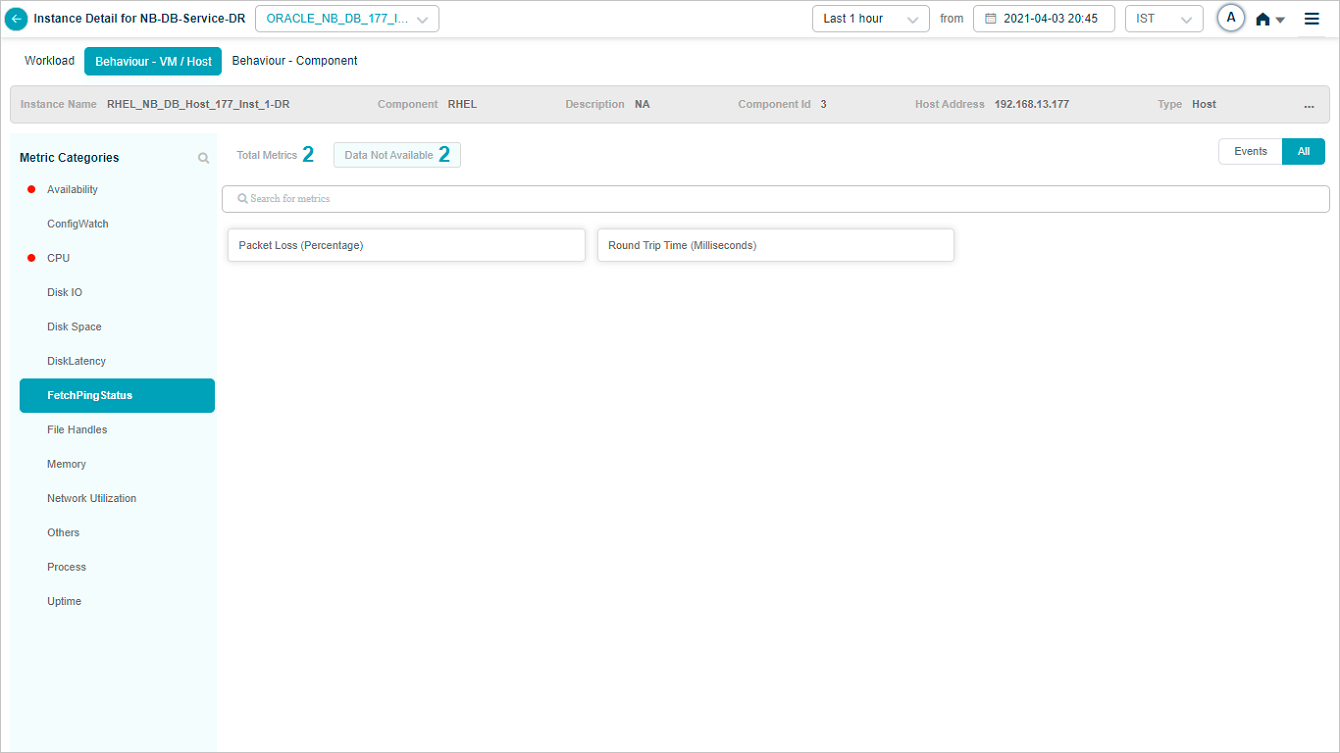
Click Data Not Available to see pods of metrics that have no data:
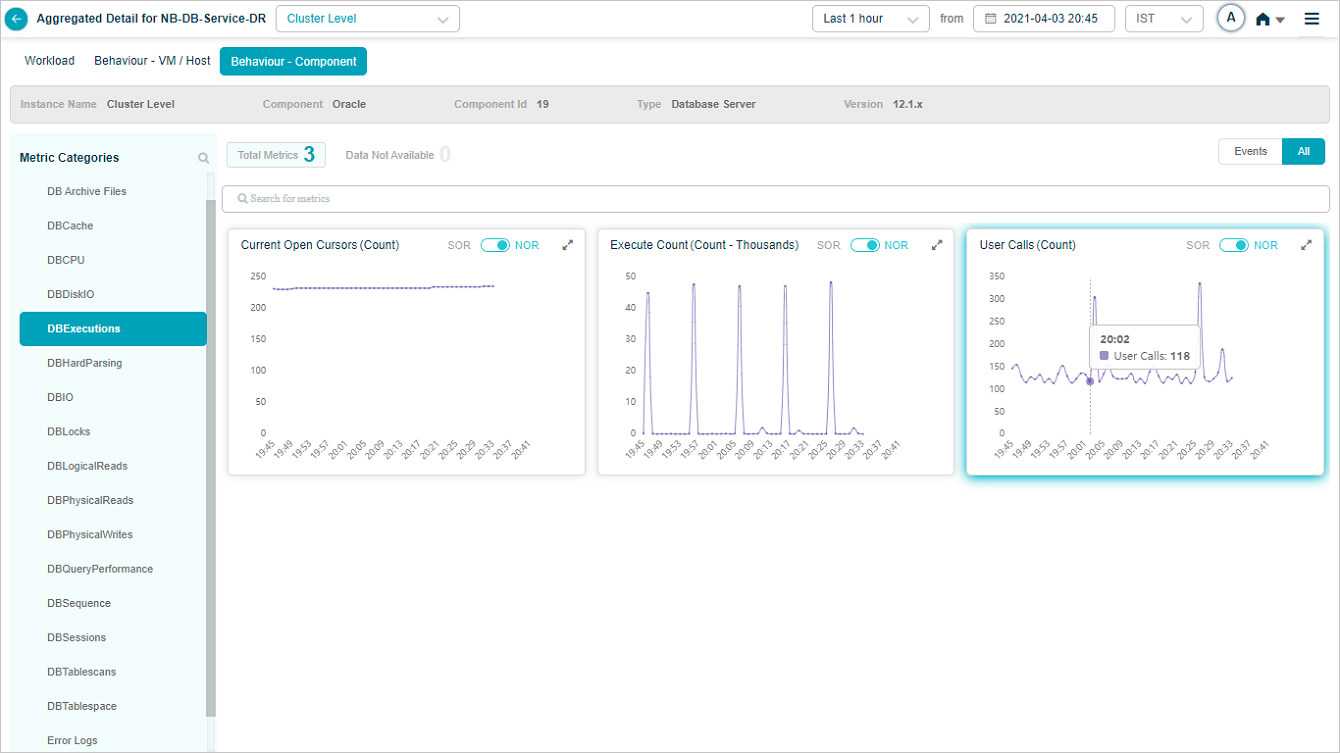
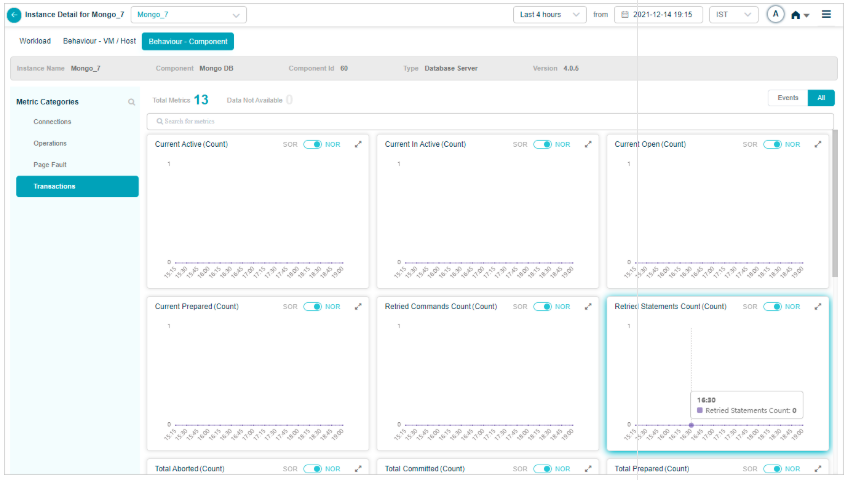
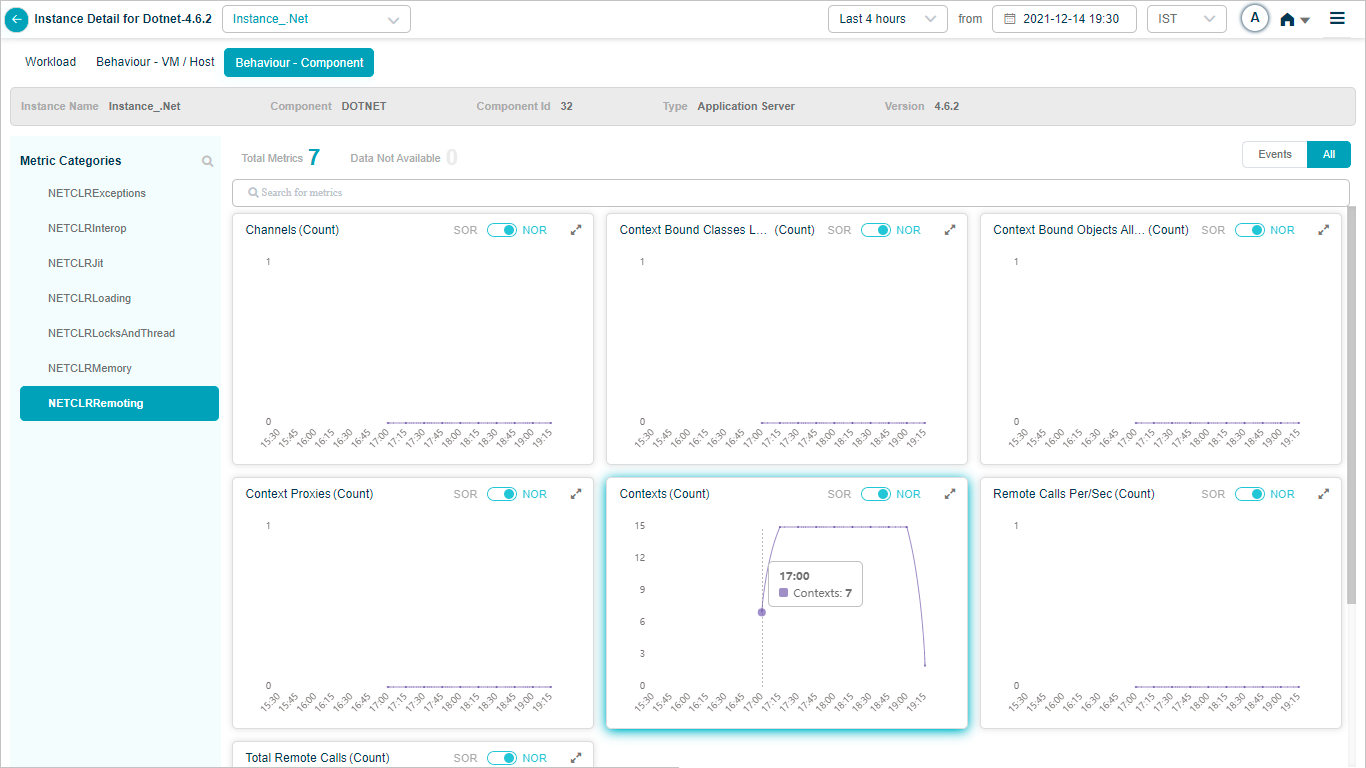
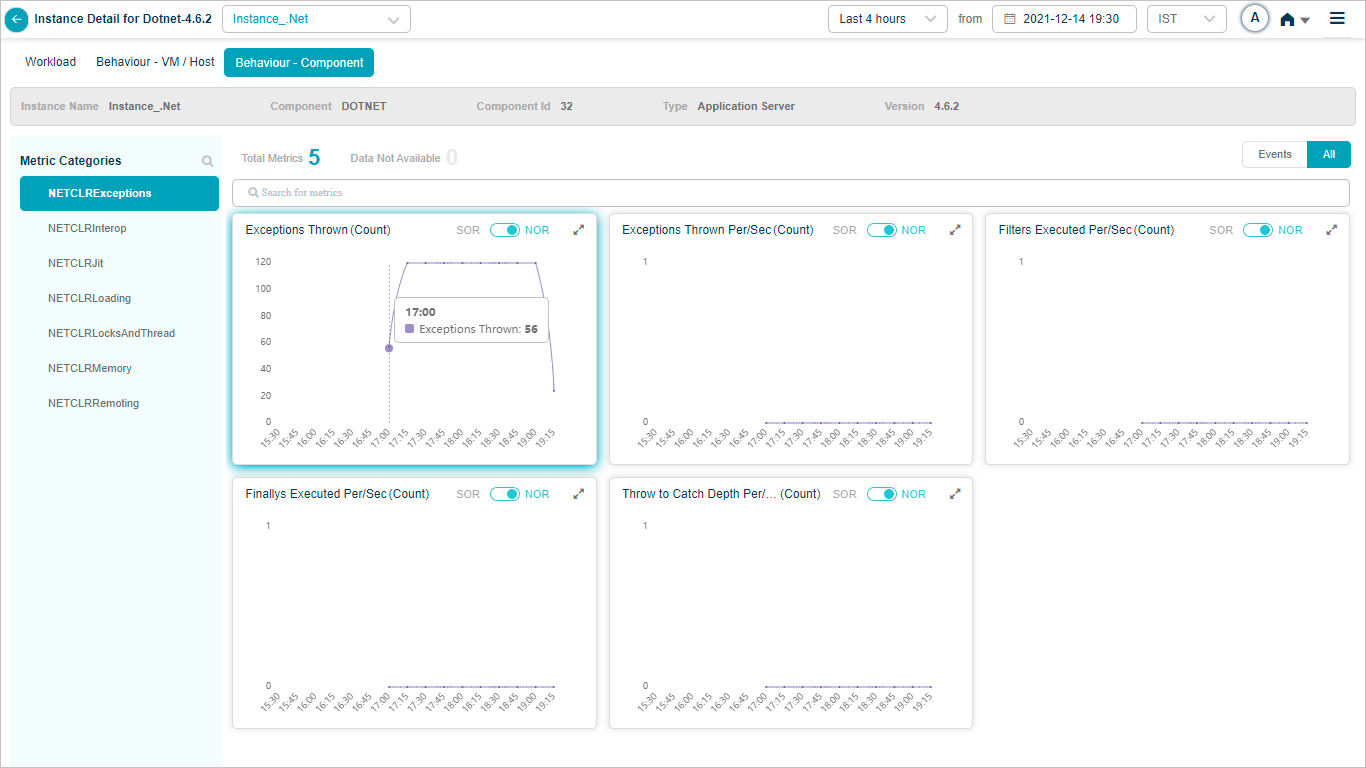
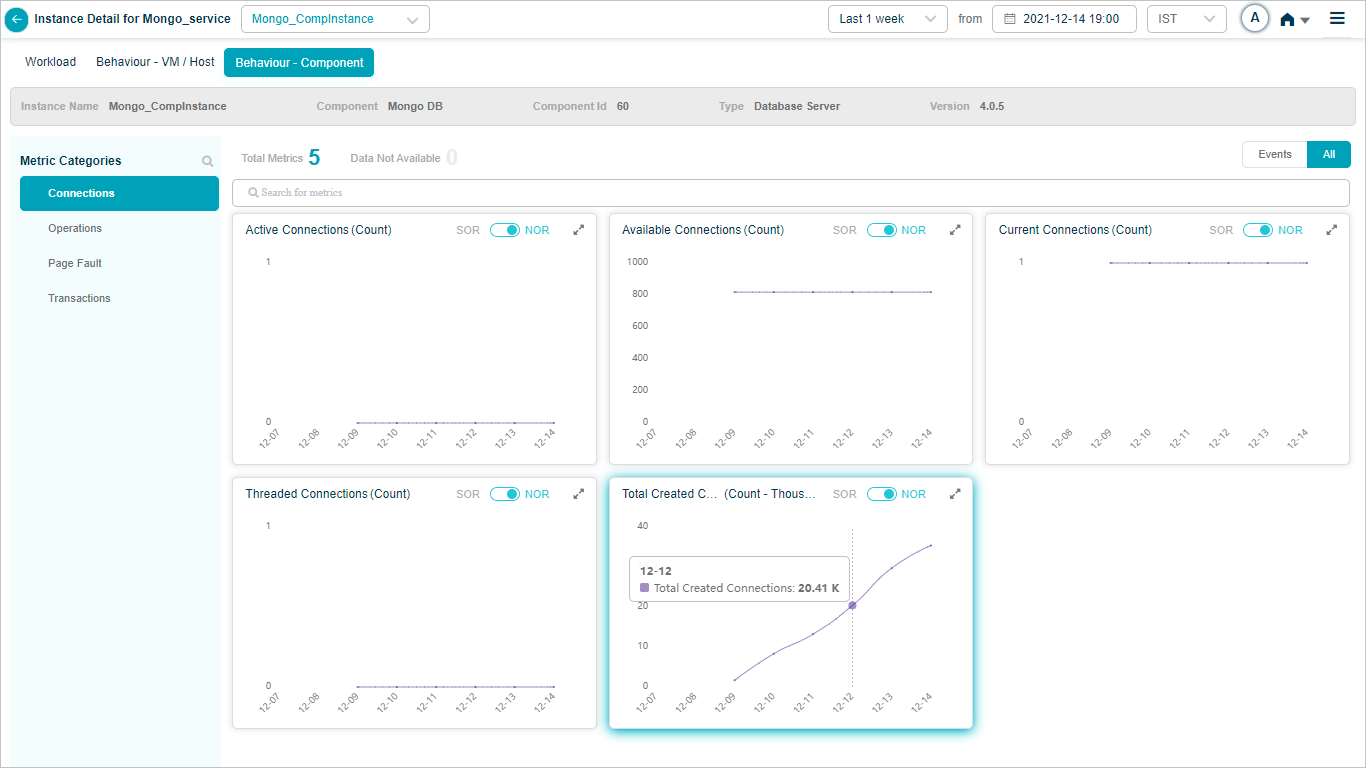
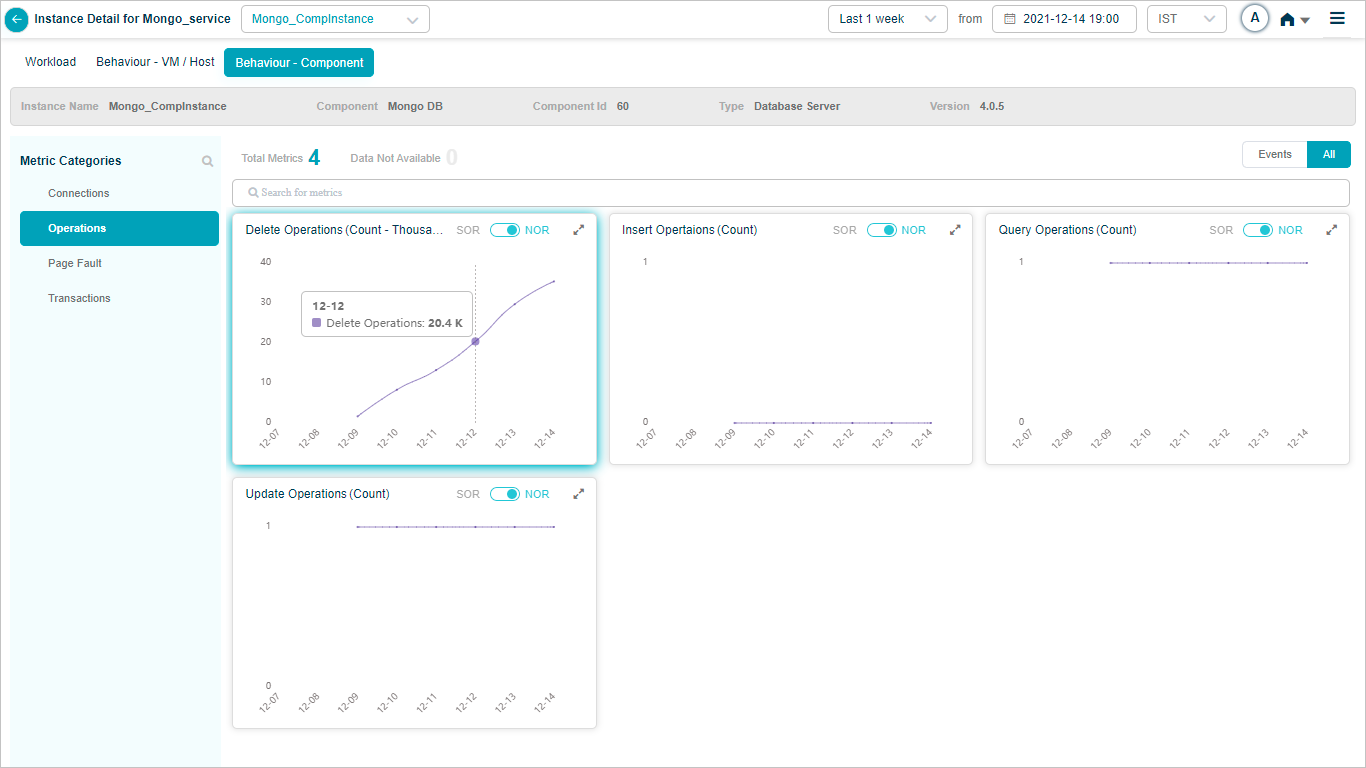
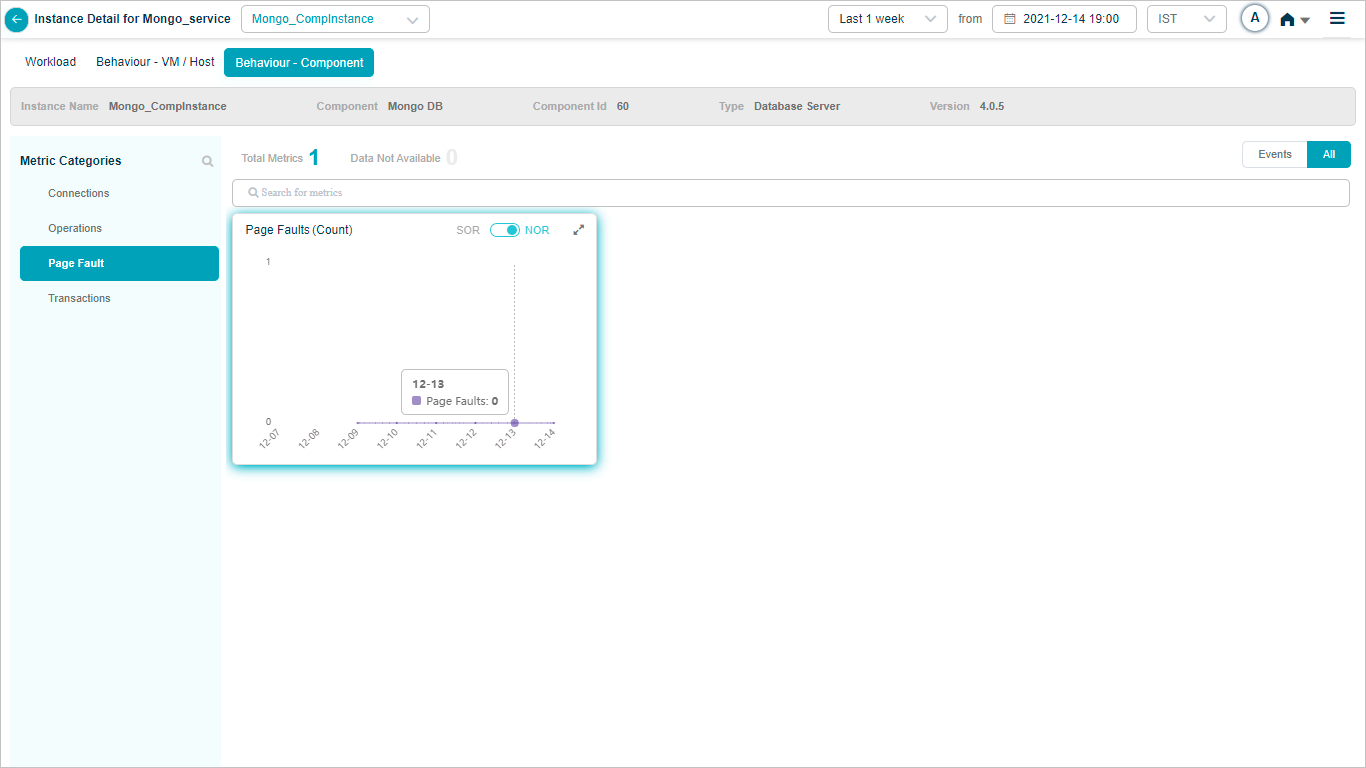
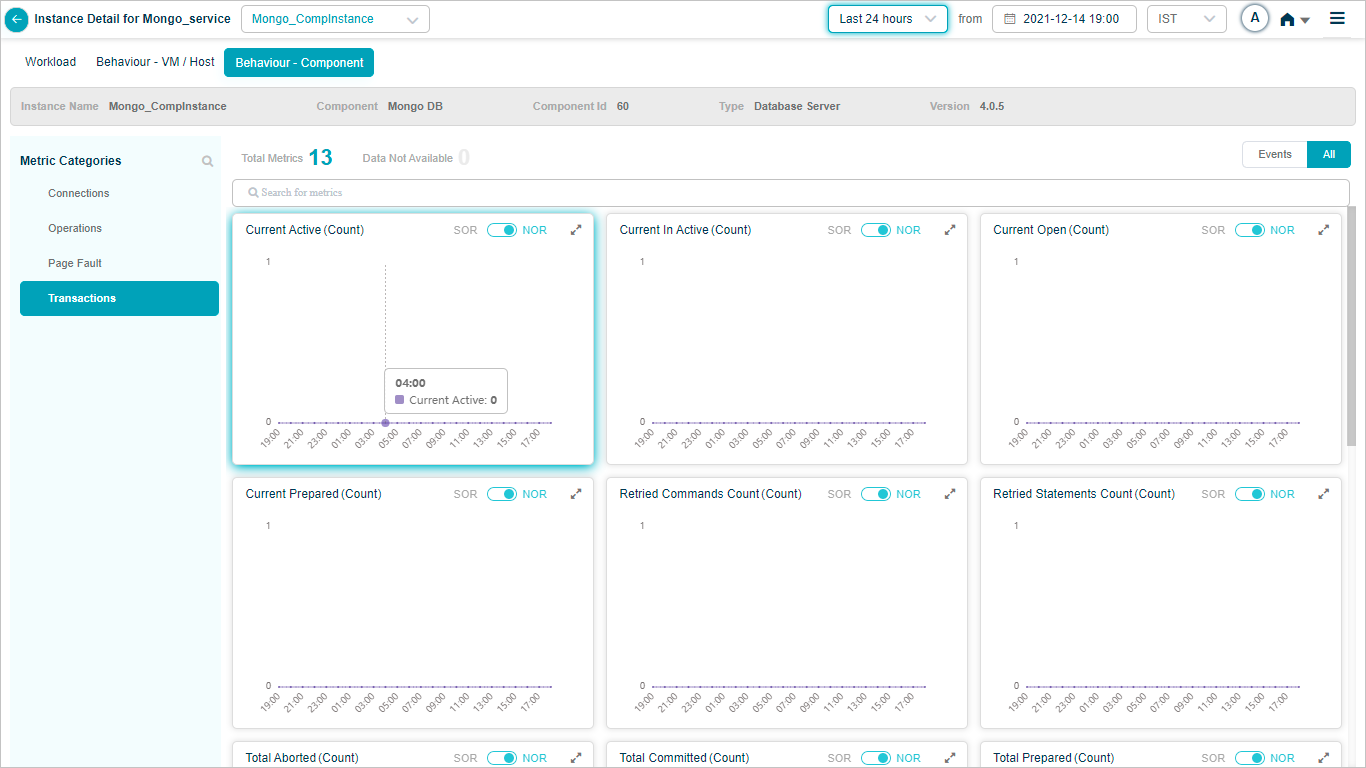
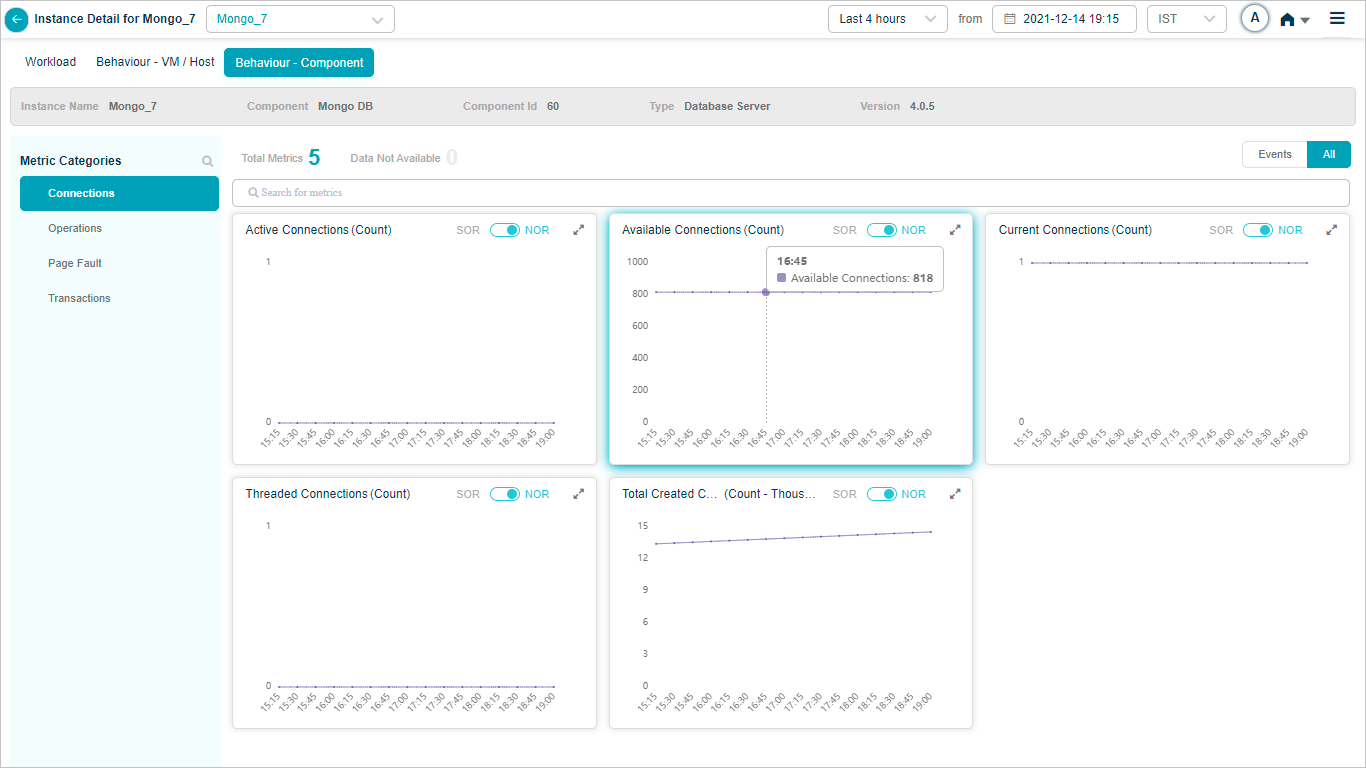
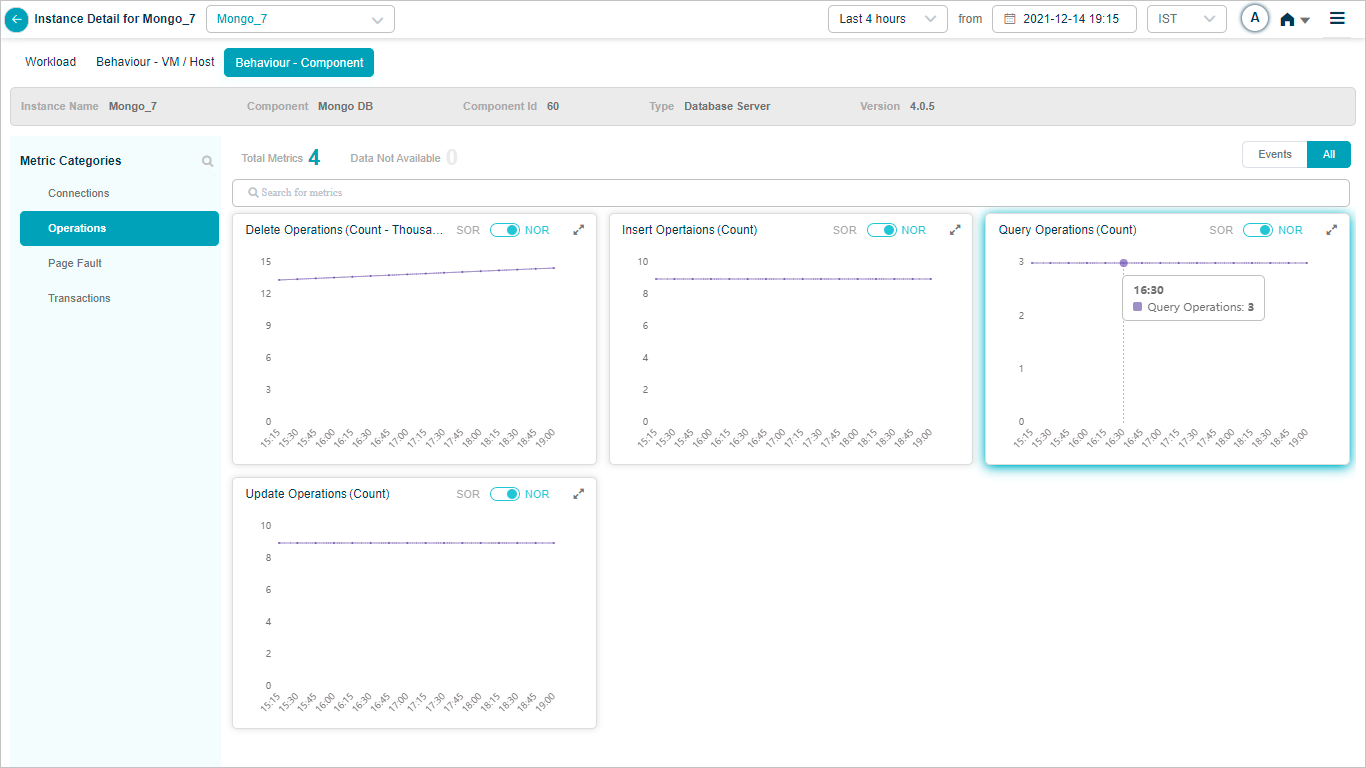
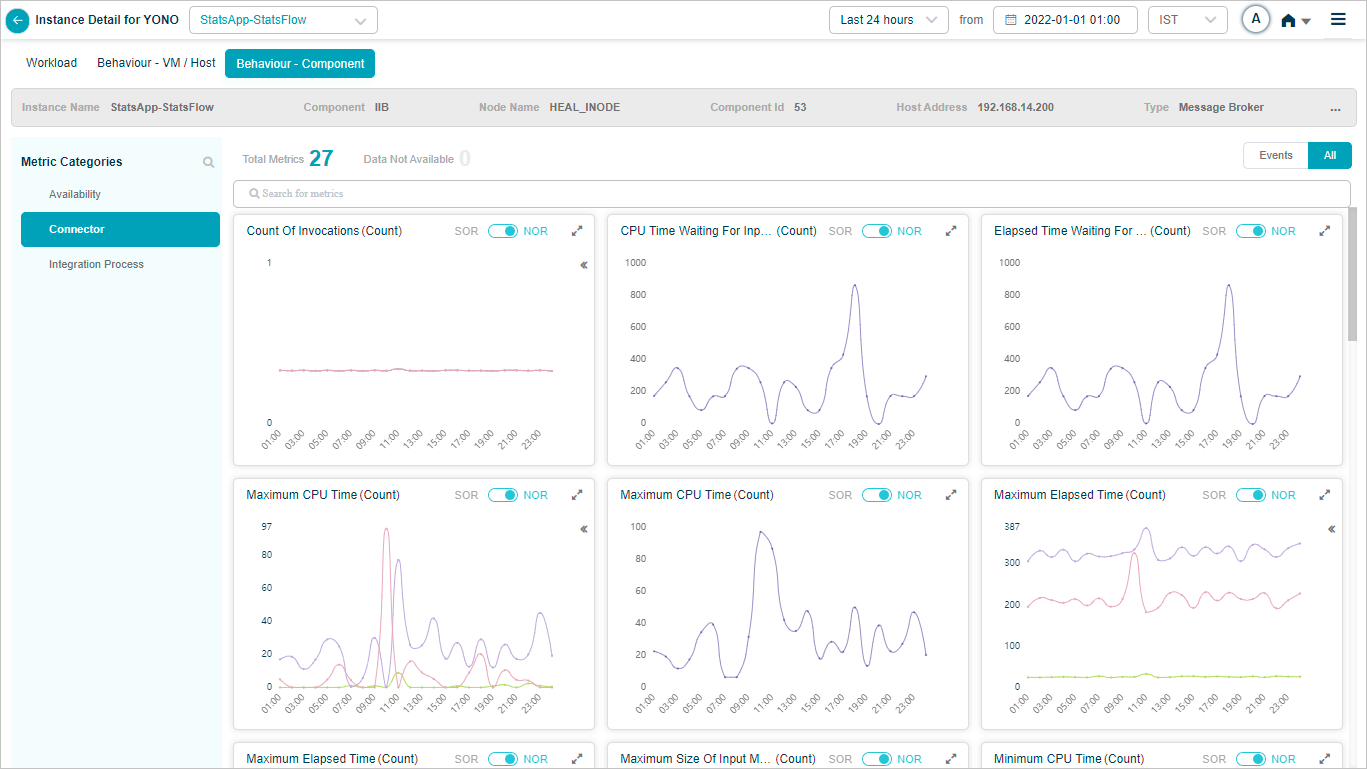
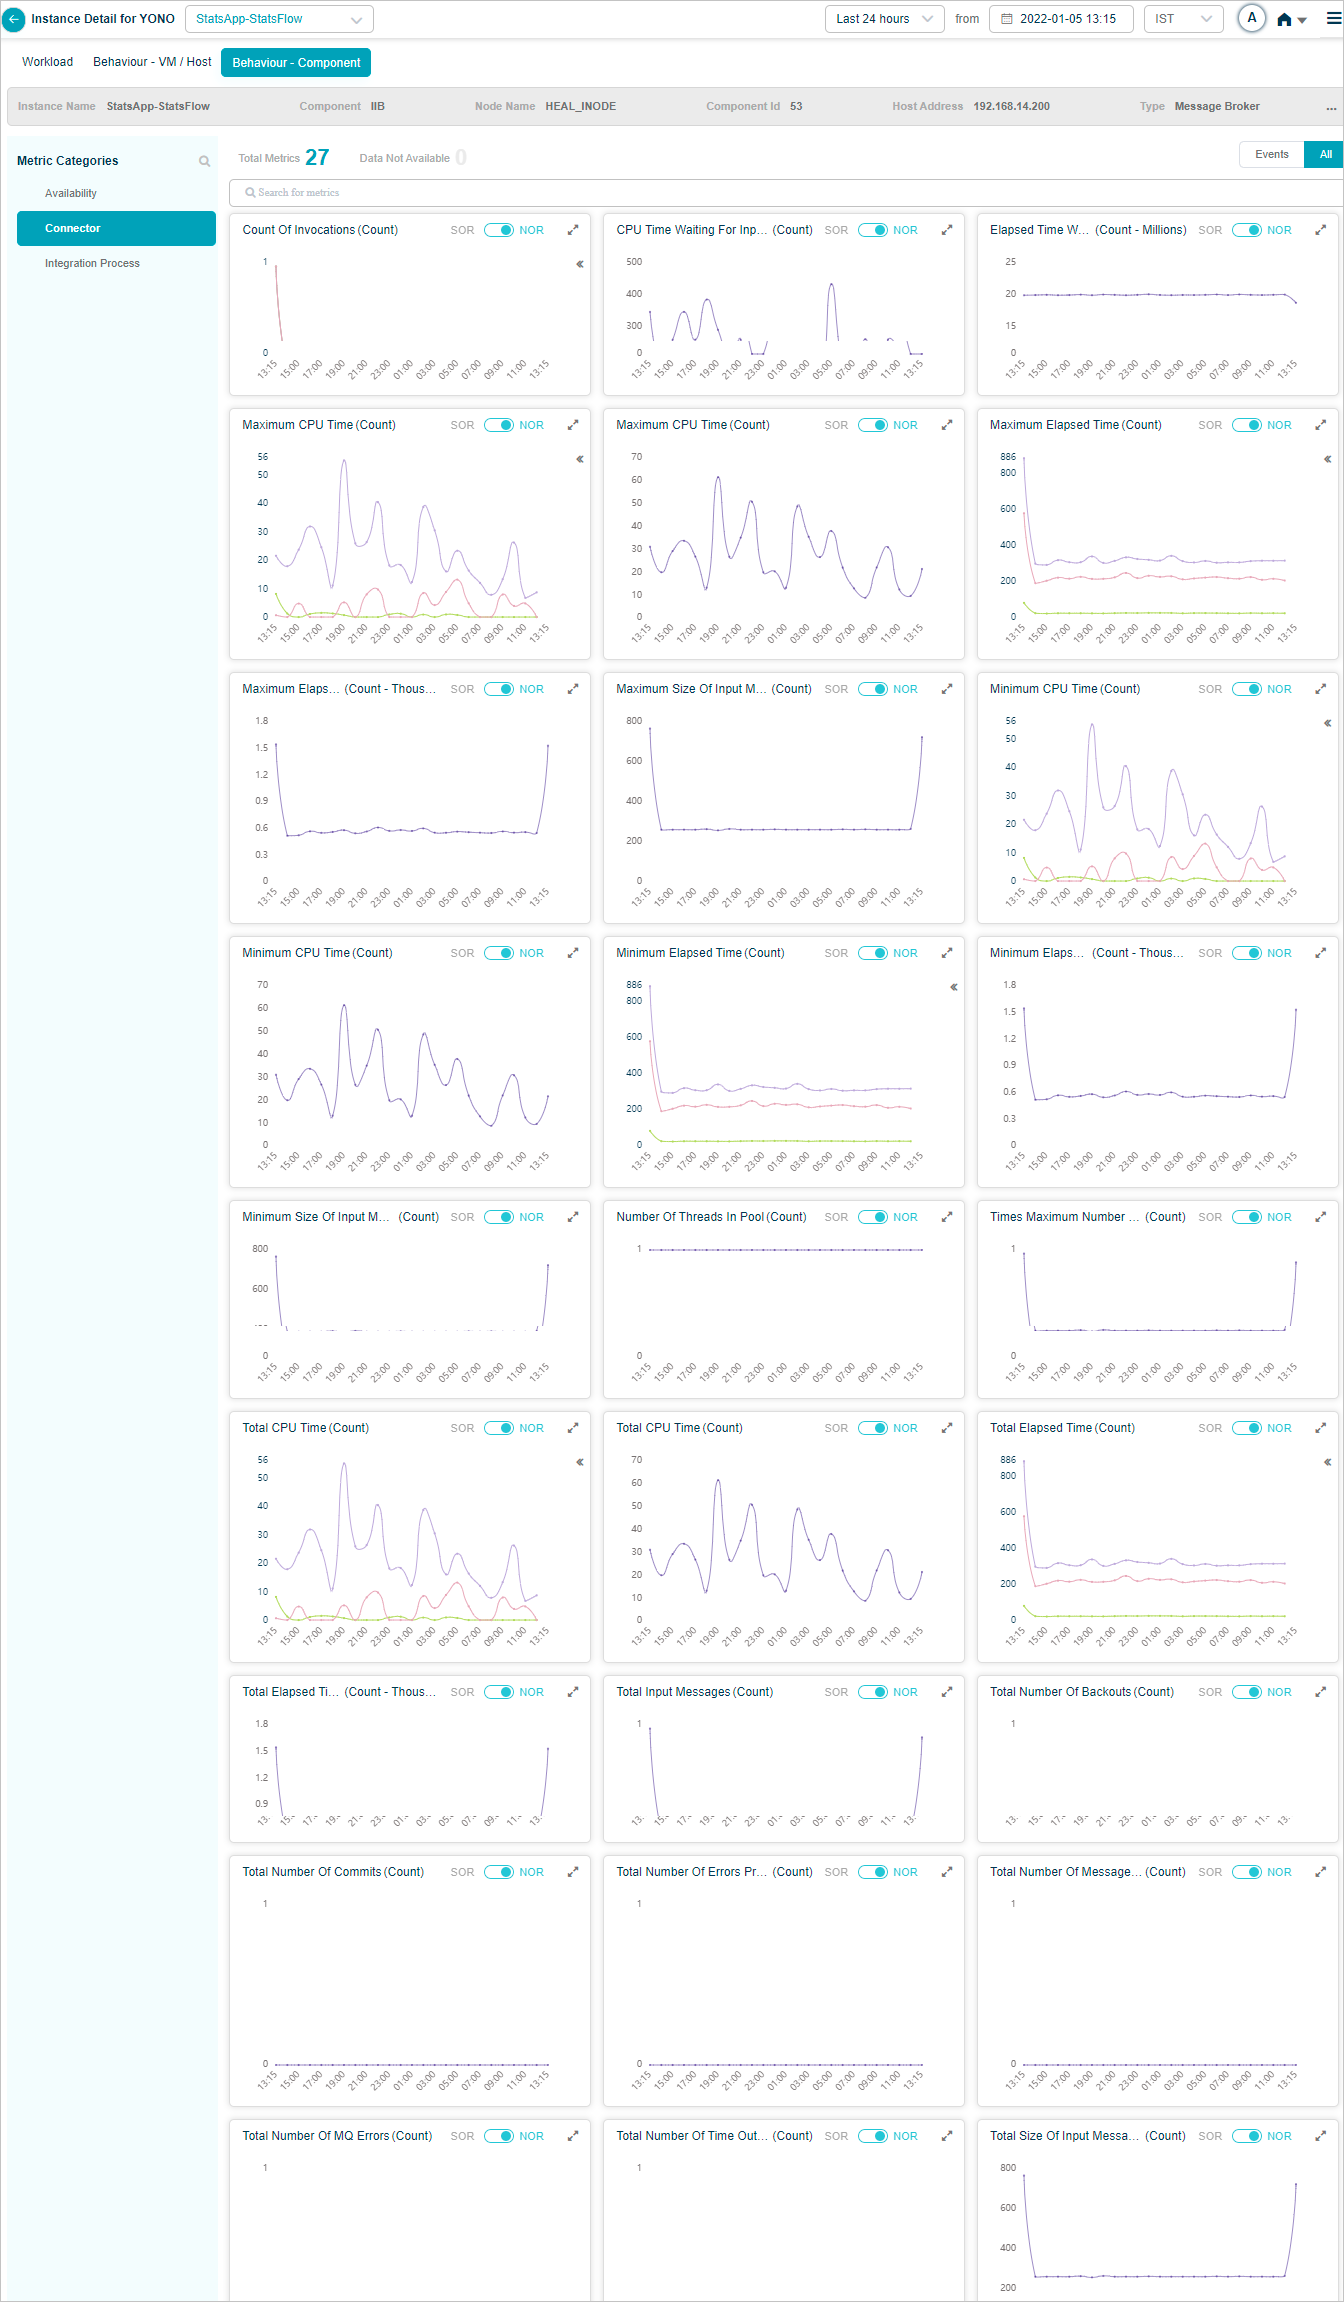
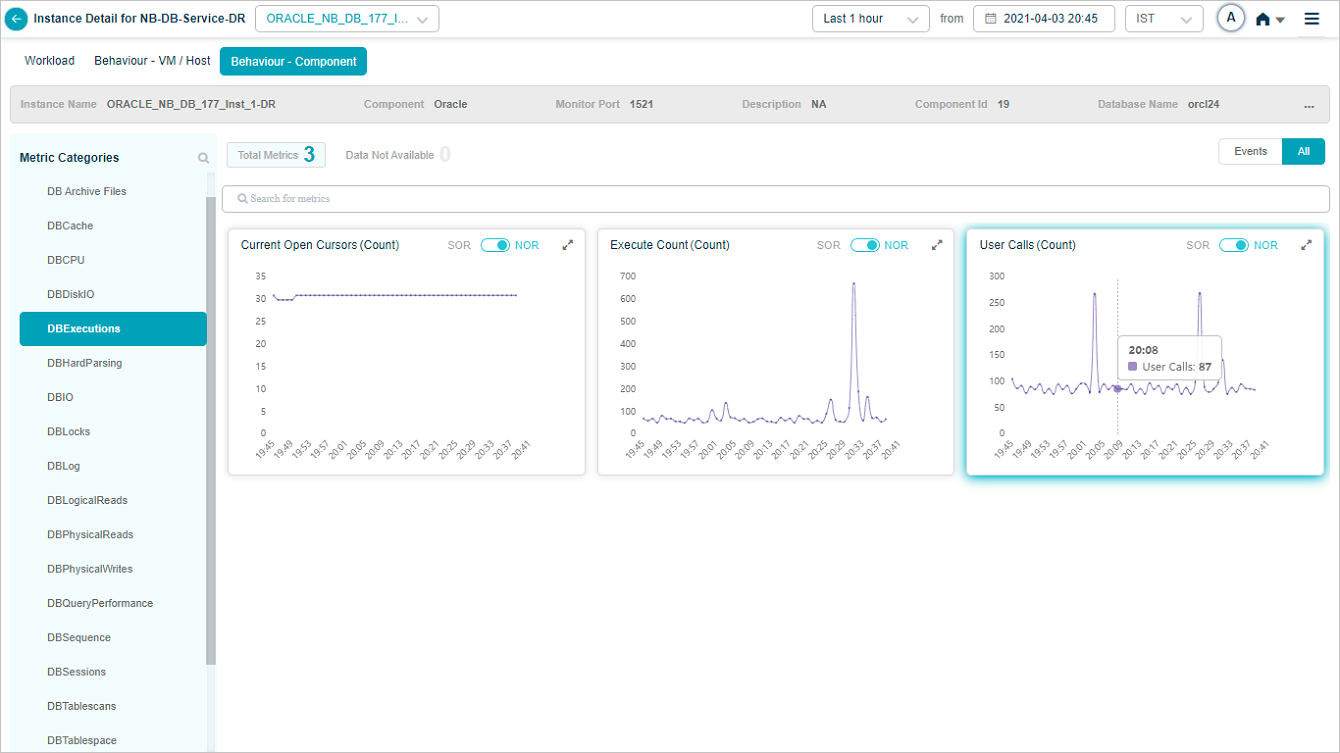
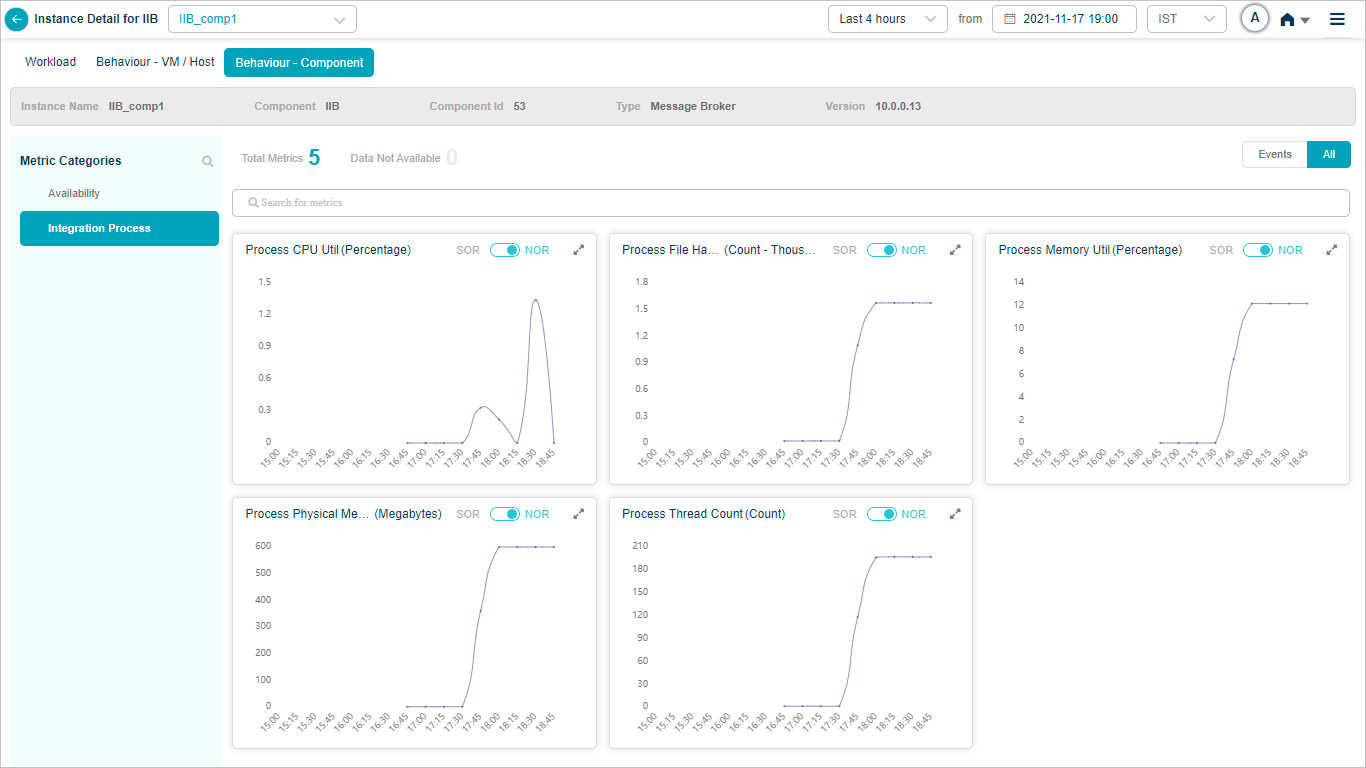
Component KPIs
When you map an instance to a component in the Control Center, HEAL collects and shows that component’s KPIs in Service Details. Supported components include:
- DOTNET
- MongoDB
- MariaDB
- IIB and IIB Connector
- NGINX
- Cloudant DB
- Apache ActiveMQ
- FFDC log monitoring
- DB2
- Elasticsearch
- HAProxy
- SUSE Linux
- Logstash
- Node JS
- JIM Agent (thread KPIs)
- IBM MQ
- Power BI
- IBM Storage (SAN_NAS)
- IBM HTTP Server
- WebSphere
- Zookeeper (for Kafka)
- Kafka
DOTNET
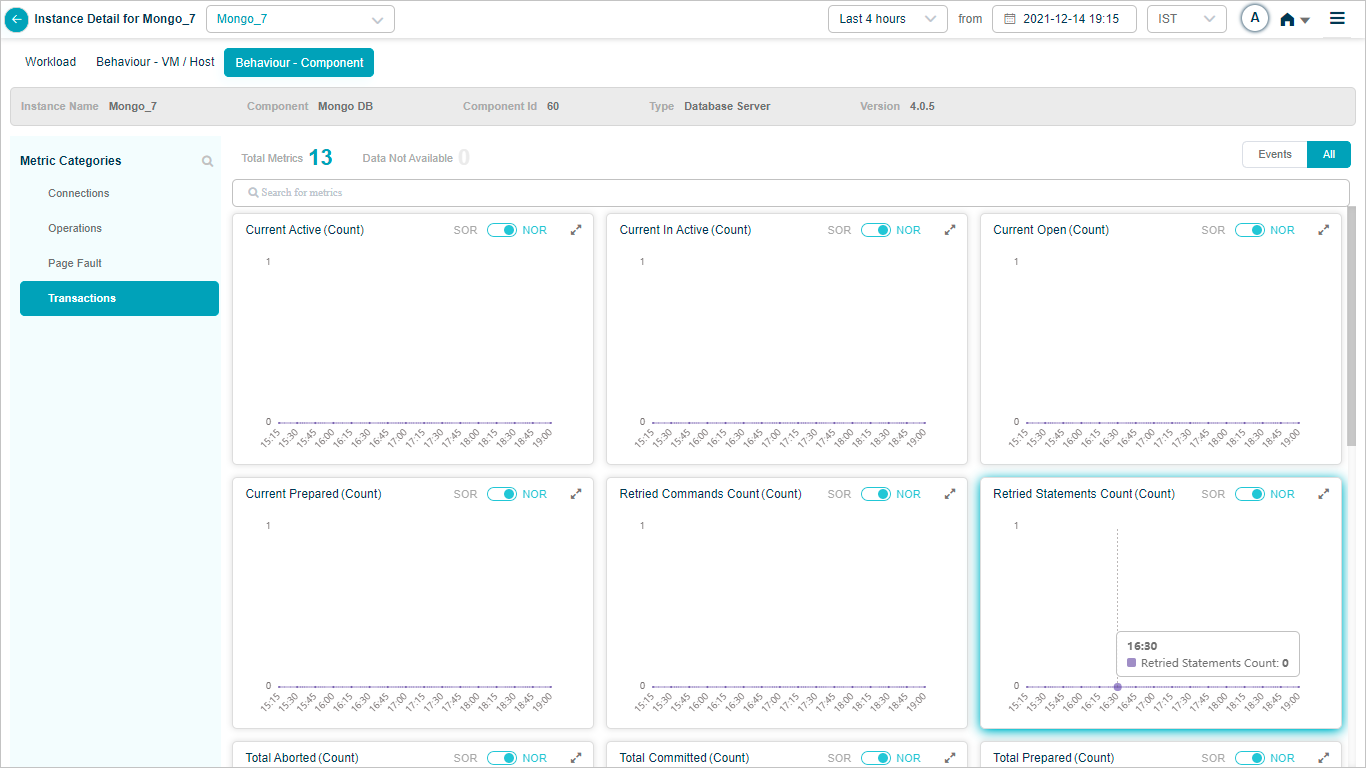
MongoDB
MariaDB
IIB Connector
NGINX
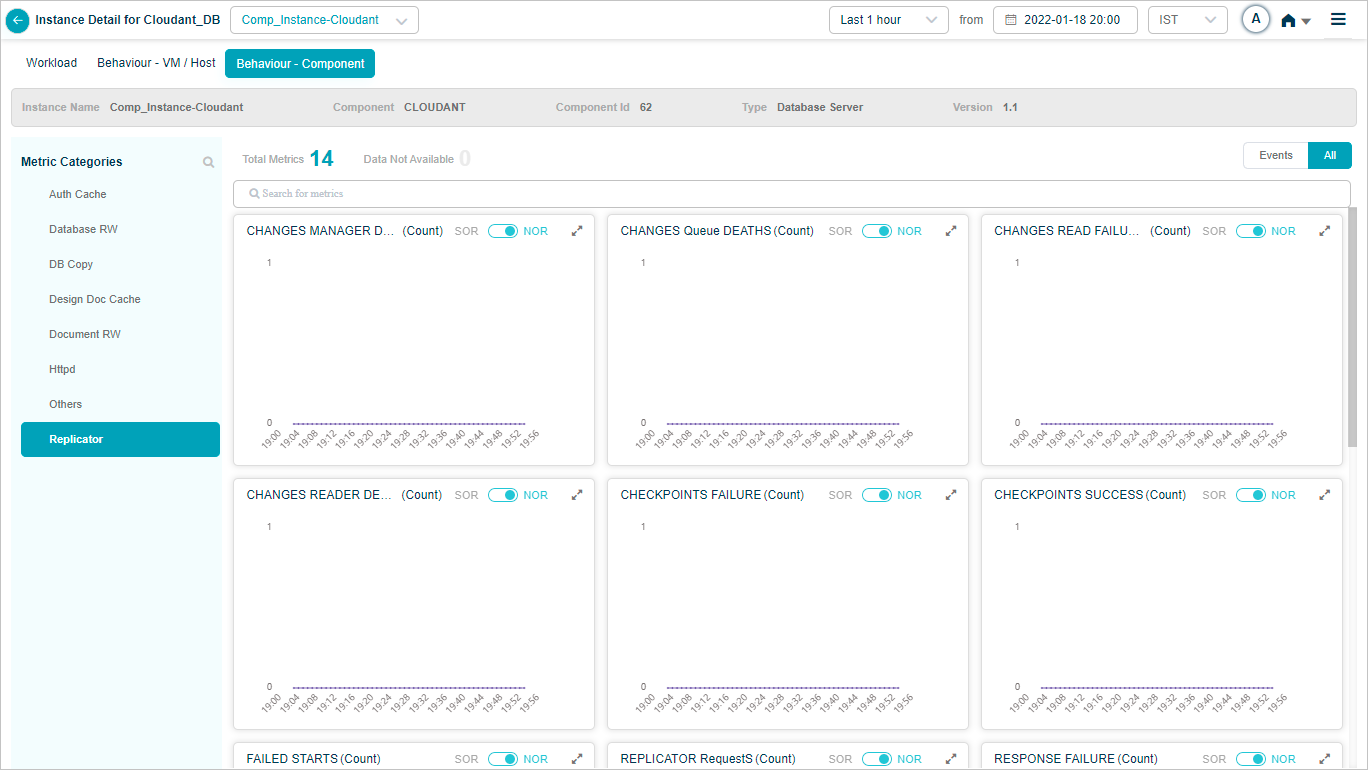
Cloudant DB
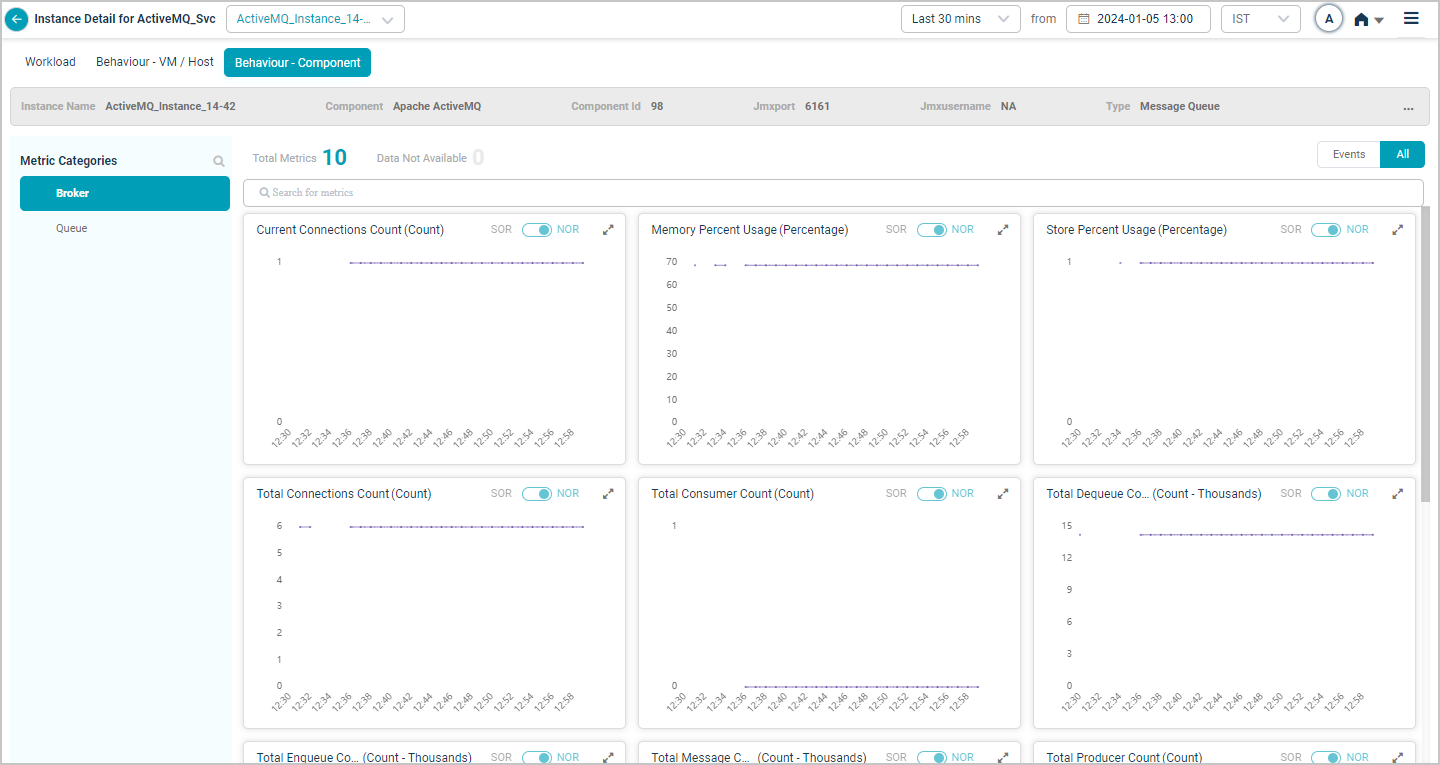
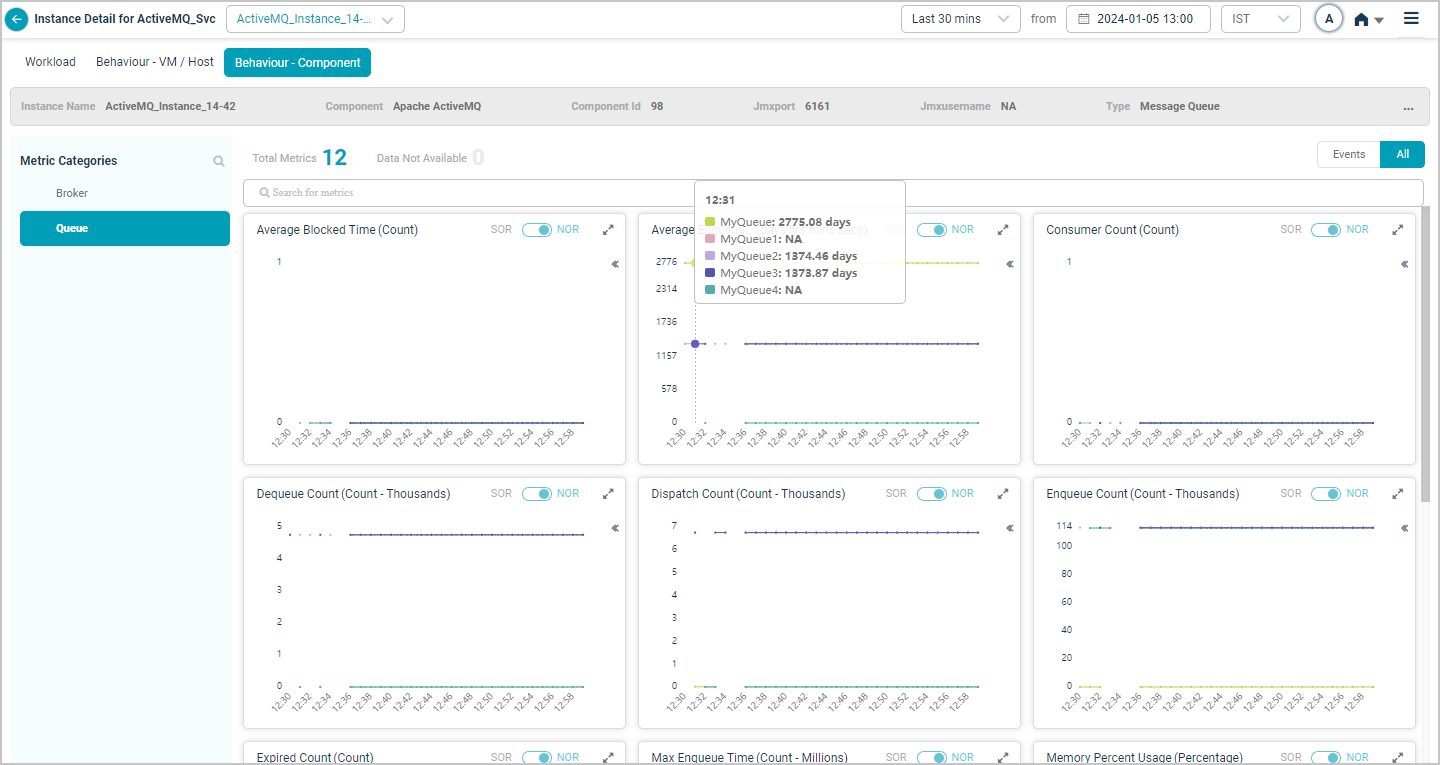
Apache ActiveMQ

FFDC log monitoring
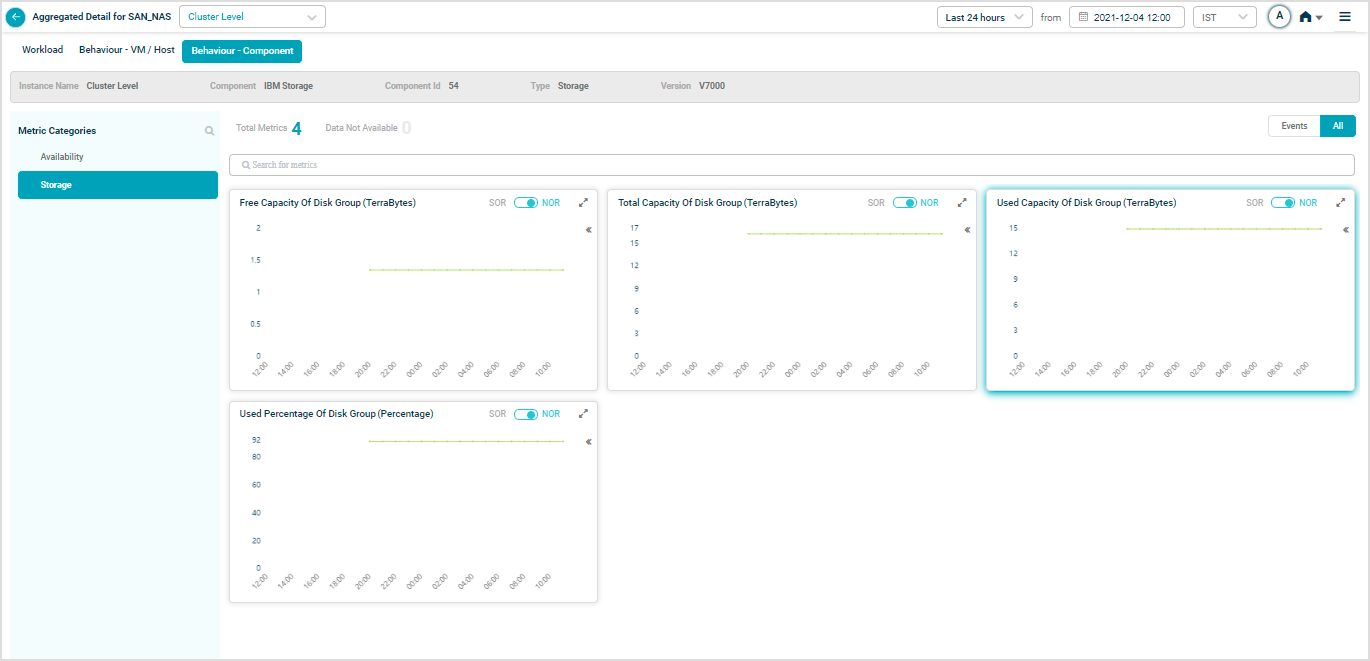
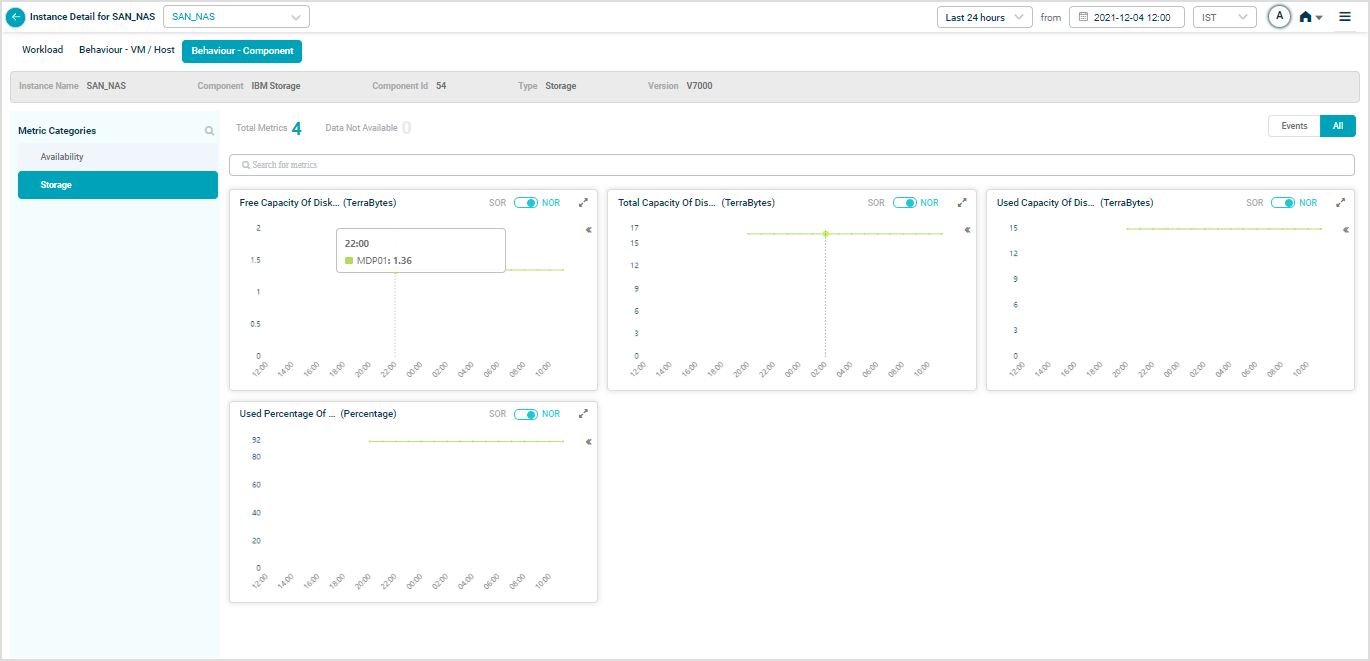
IBM Storage
Map SAN_NAS instances to the IBM Storage component to see IBM Storage KPIs.
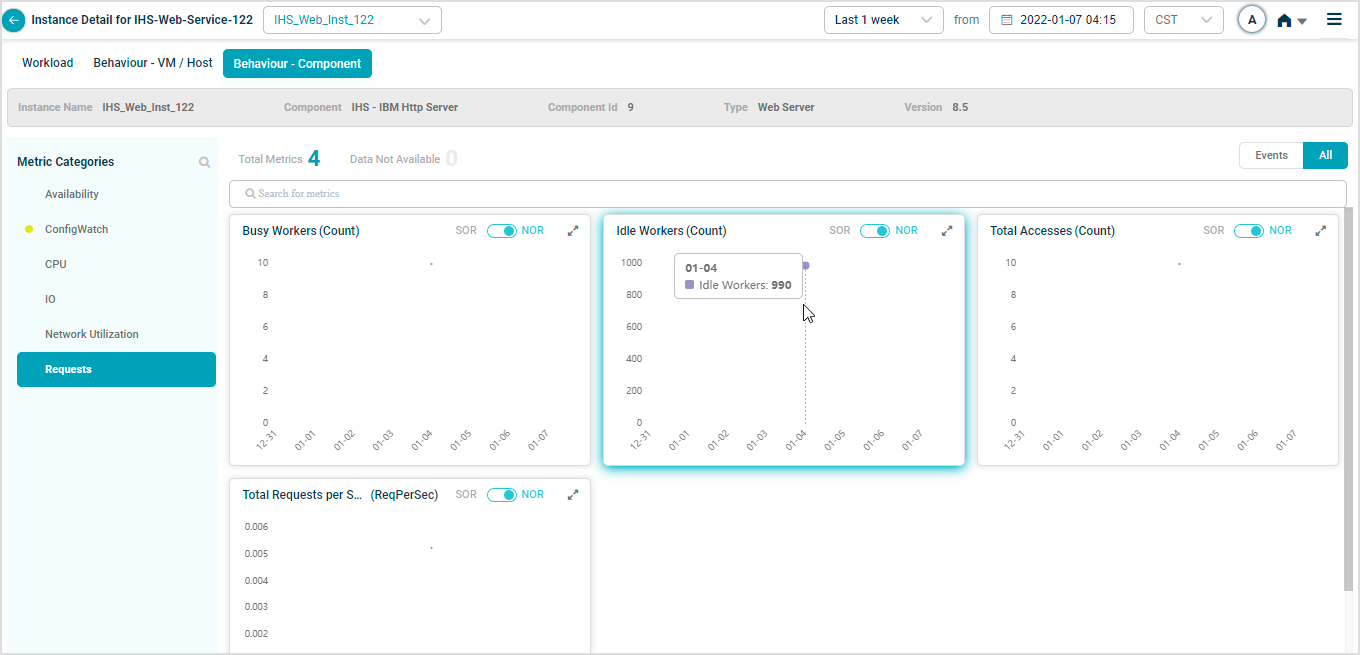
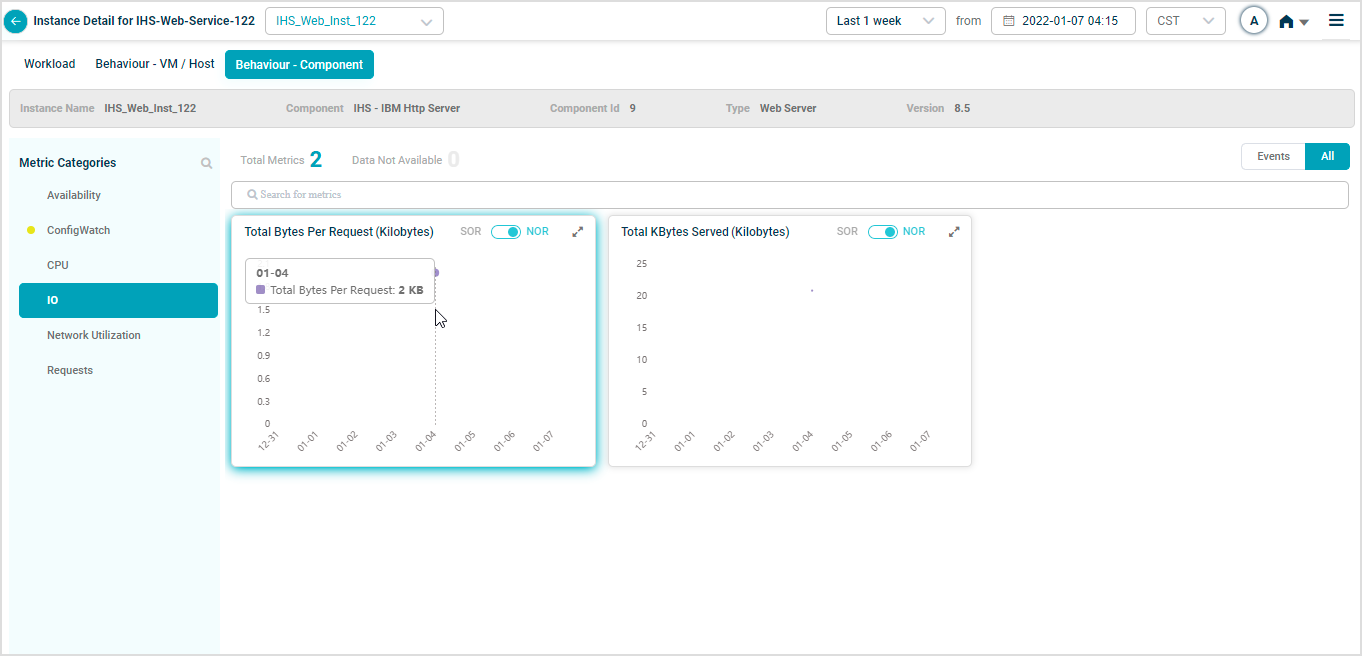
IBM HTTP Server
Map IHS-Web-Service-122 instances to the IBM HTTP Server component.
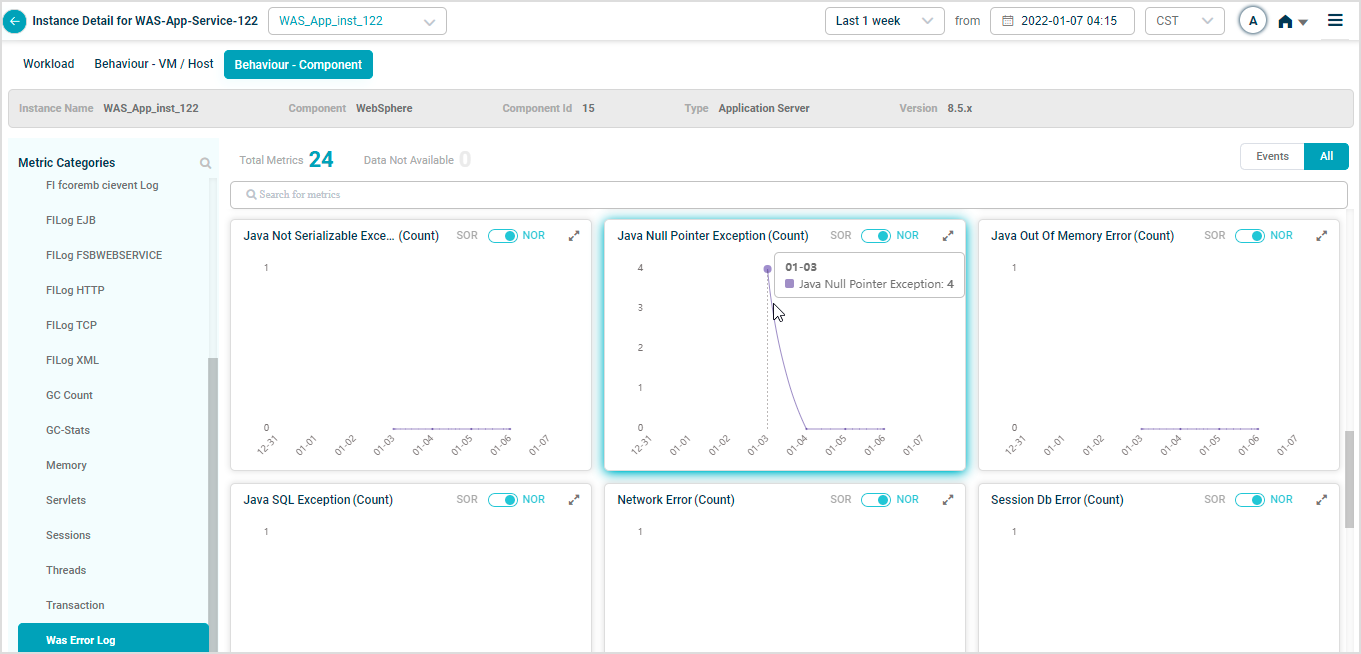
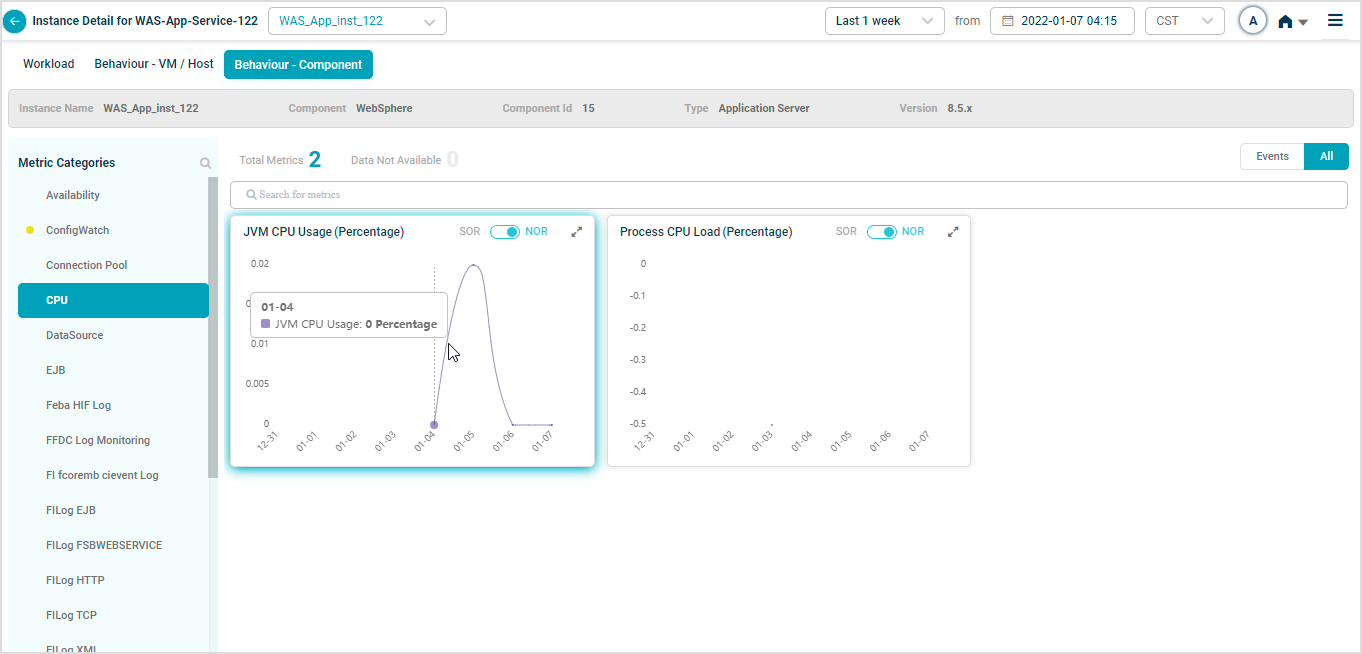
WebSphere
Map WAS-App-Service-122 instances to the WebSphere component.

JMX MBeans
HEAL monitors the MBeans and attributes the Java platform exposes out of the box. Two key garbage-collection KPIs:
- Garbage Collector – Collection Time. Total time spent on garbage collection in milliseconds.
- Garbage Collector – Collection Count. Number of garbage collection events since the JVM started.
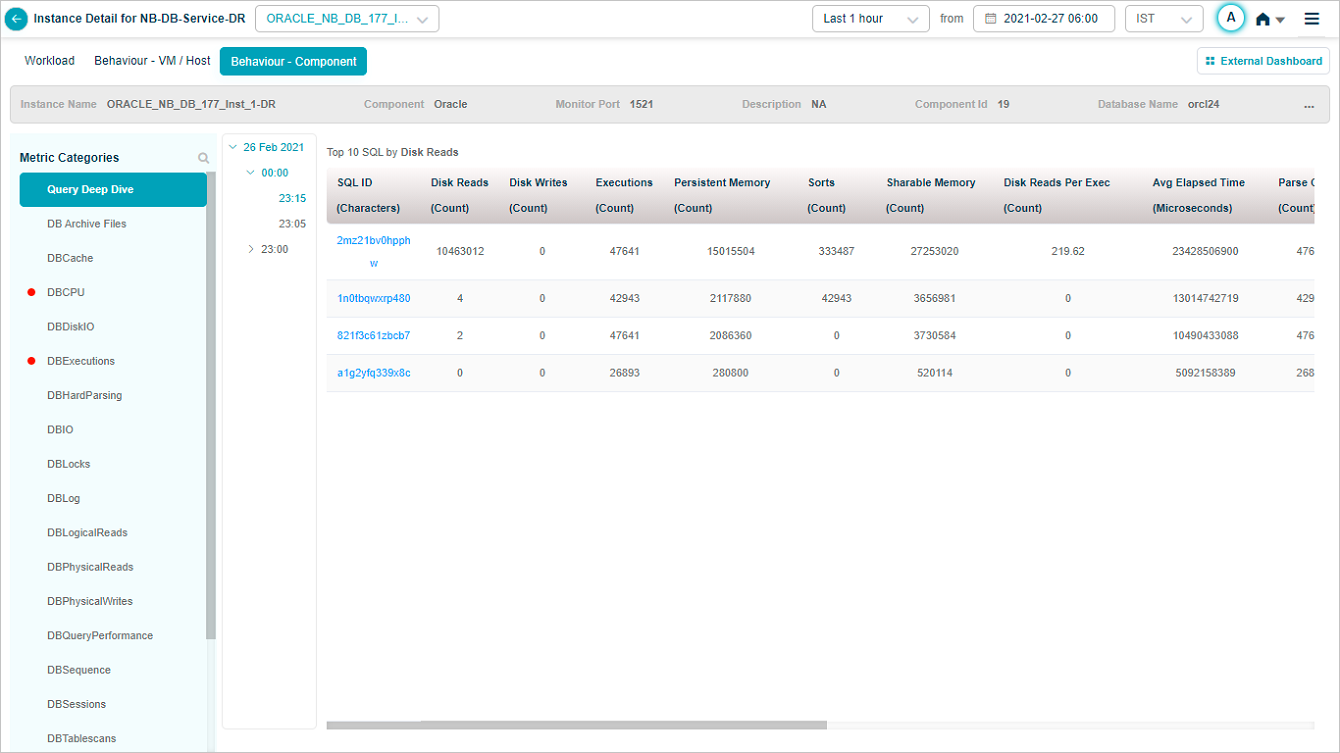
Query Deep Dive
For databases, Service Details has a Deep Dive section that captures the top slow-running queries that are eating database resources.
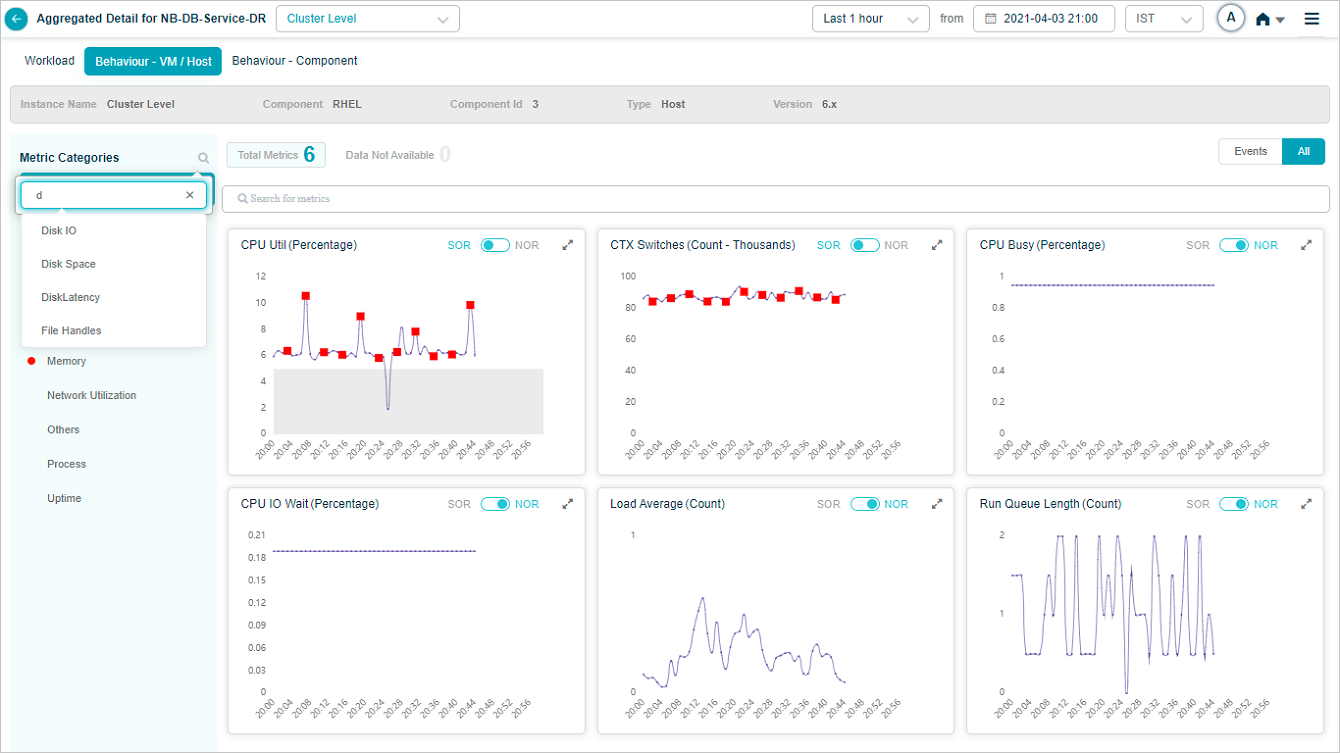
Search metrics and categories
Click the search box to see every metric in a category, then pick the ones you want.
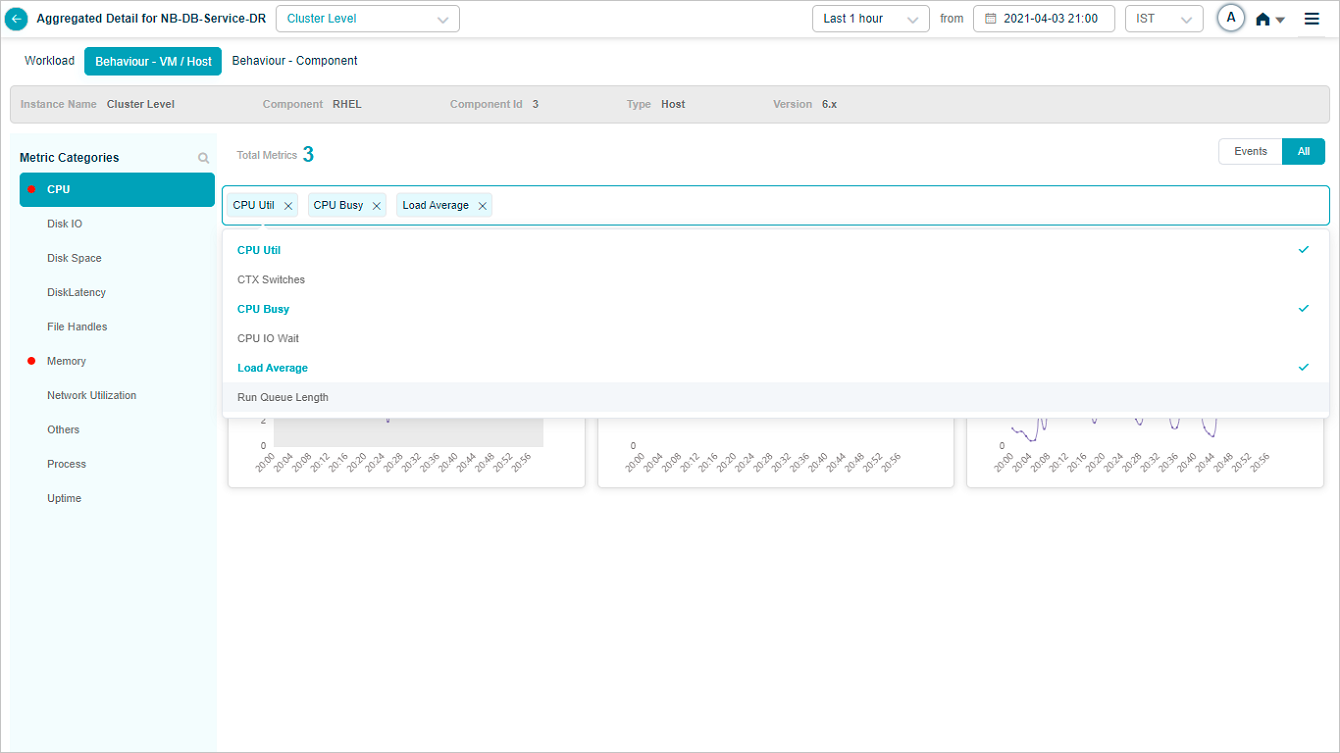
Data for the selected metrics is shown.
HEAL keeps your selection across cluster and instances. If you pick three KPIs for one instance and switch to another instance, the new instance shows those same three. All shows every KPI you ever selected. Events filters down to KPIs with events.
Click the icon in the left pane to search for KPI categories by full or partial name.
KPI event details
Click any red dot in a KPI trend to see event-specific details.

1. Date and time the event occurred.
2. KPI value at that moment.
3. NOR or SOR threshold range. Either the MLE or the SOR processor triggered the event because the value left the range.
4. Forensics linked to the event. Shows NA when none are available.
Anomaly score
A number between 0 and 1 that says how big or severe the event is. Every KPI and transaction with an event gets one.
KPI data at instance level
The Service Details screen at instance level looks like this.
KPI full view
Click the expand icon in any KPI pod to open the full view.

KPI description
Hover any KPI name in a KPI pod to see its description. If none is available, the message says “KPI description not available”.
Group KPIs
Group KPIs are the only KPIs that show legends. Click the icon in a group KPI pod to see every attribute in the group. Attributes with events come first.

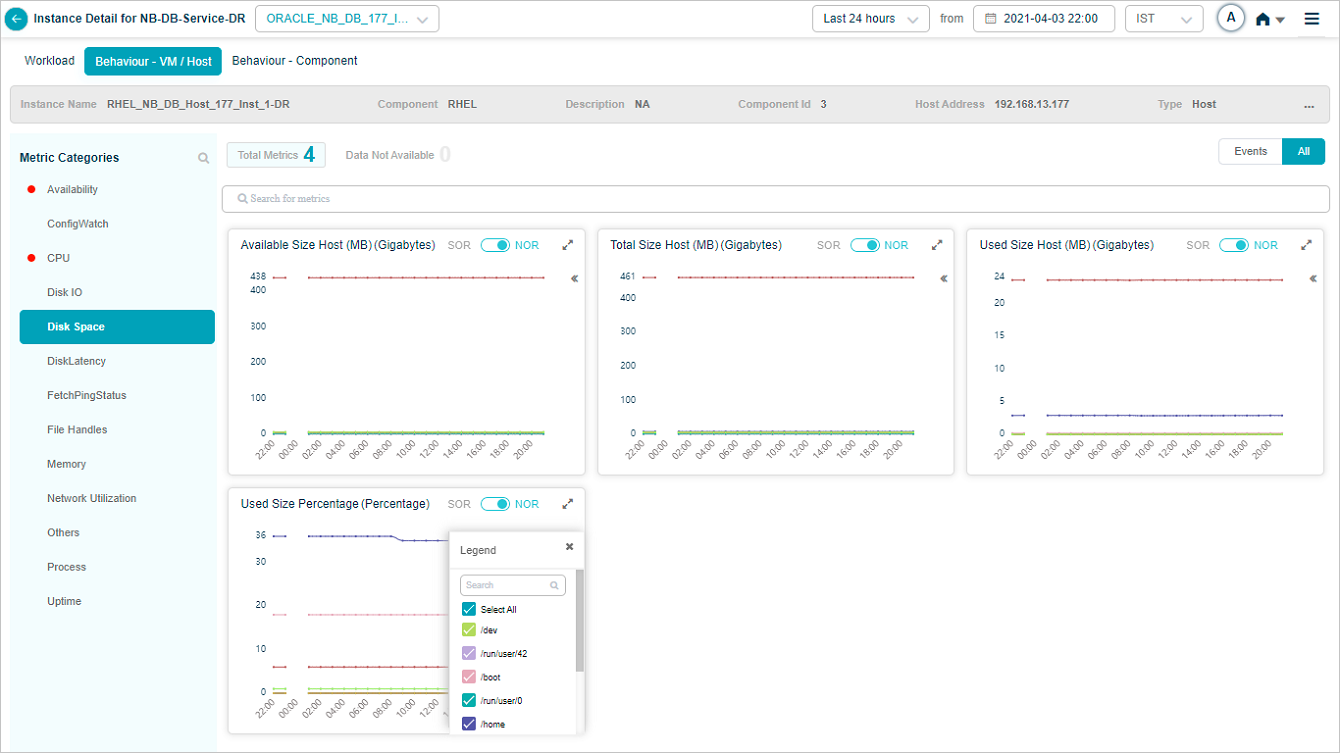
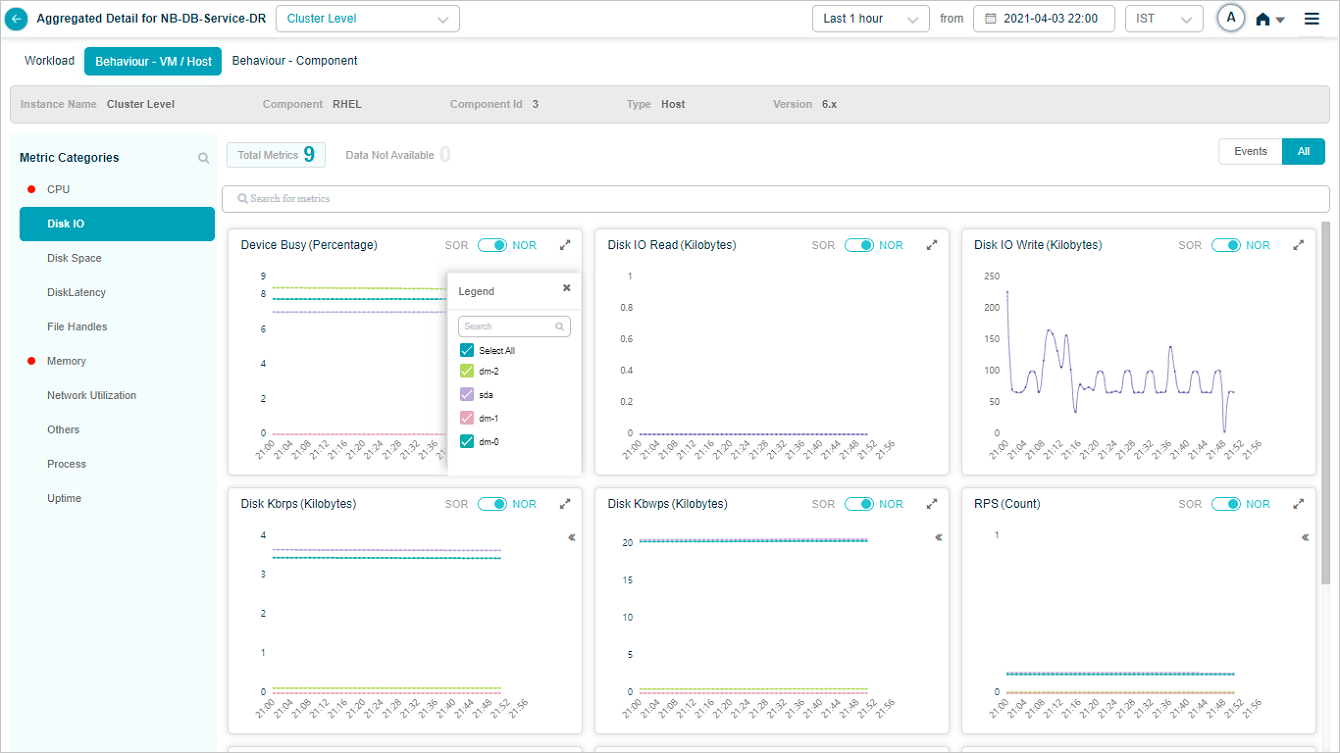
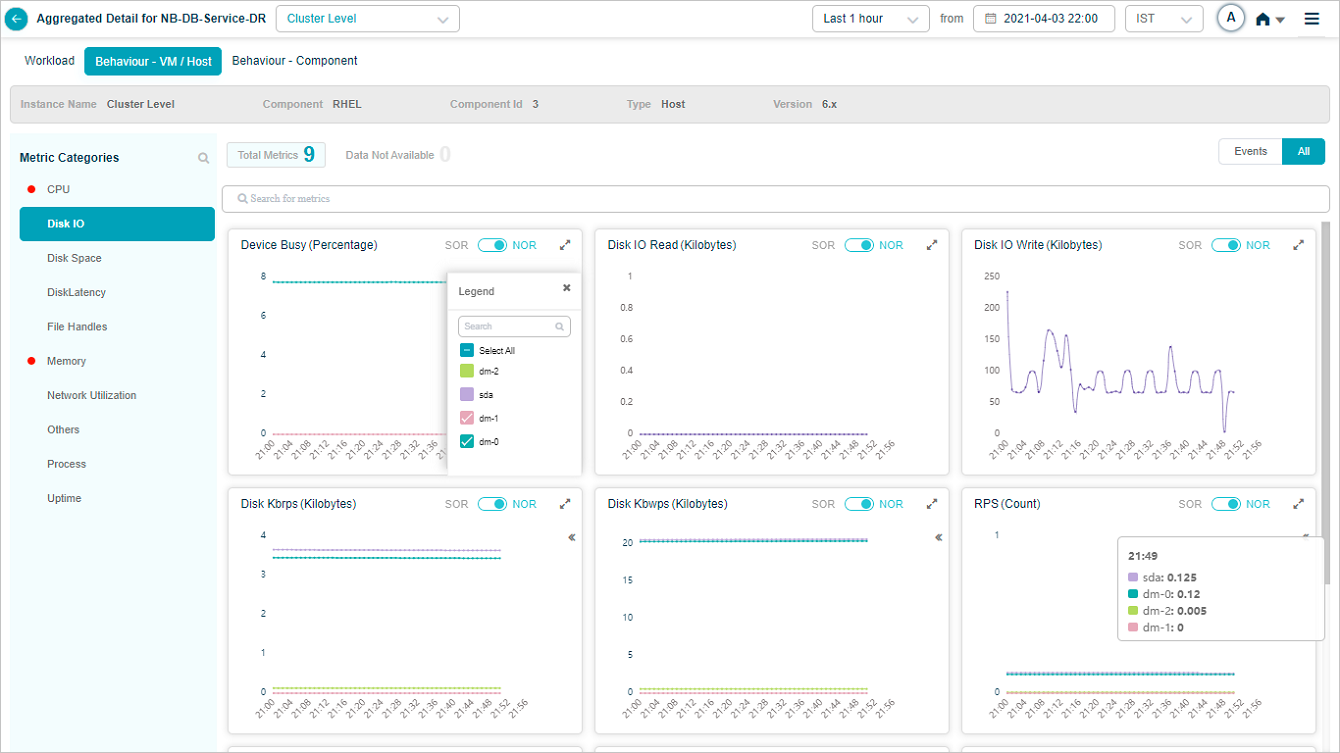
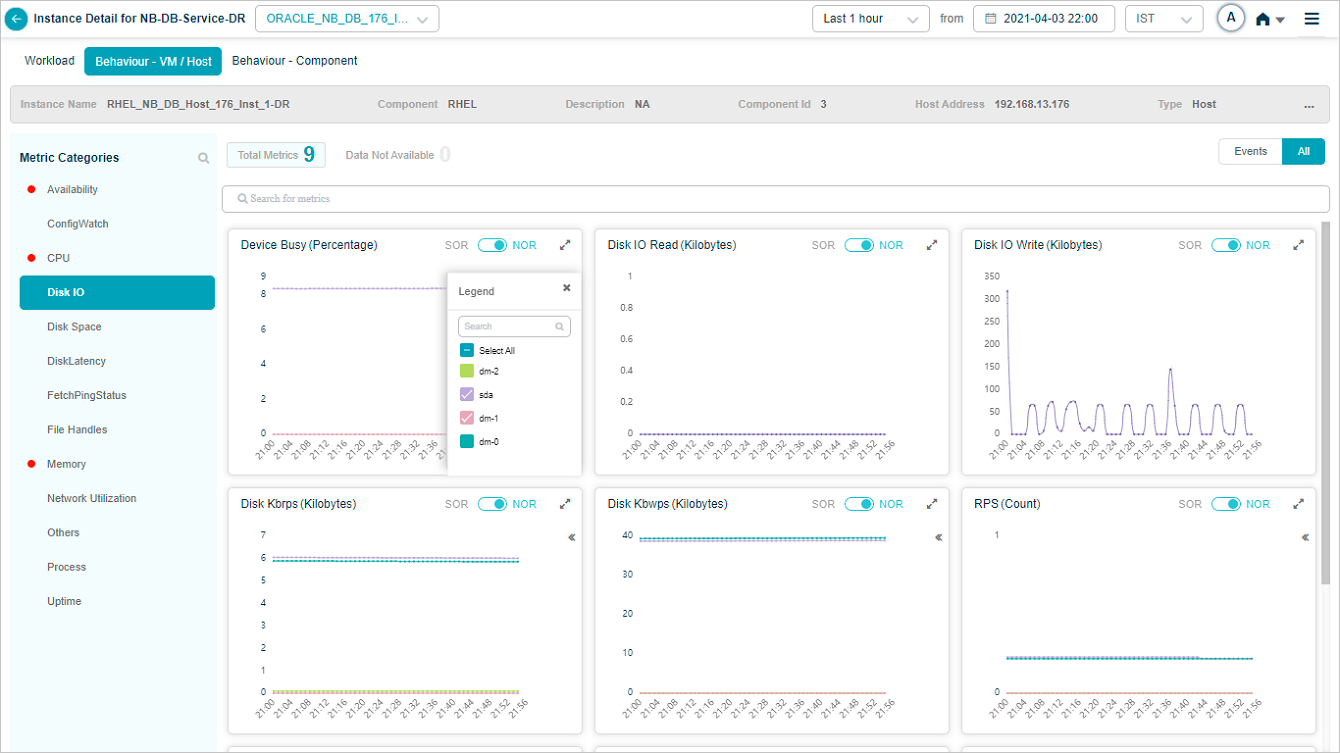

Search for attributes in the tooltip of a group metric pod. Partial or full match.
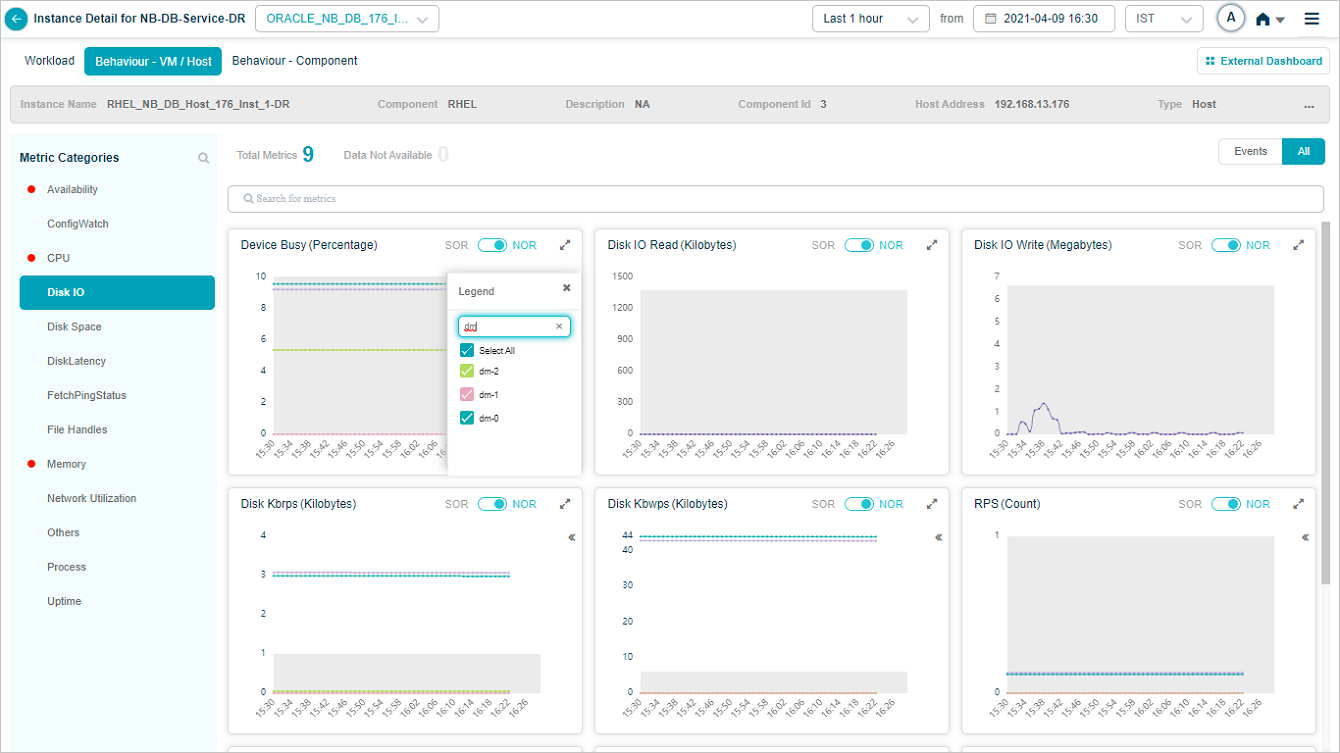
Pick or drop attributes from the search results, and the metric pod updates to show the data for the selected ones.

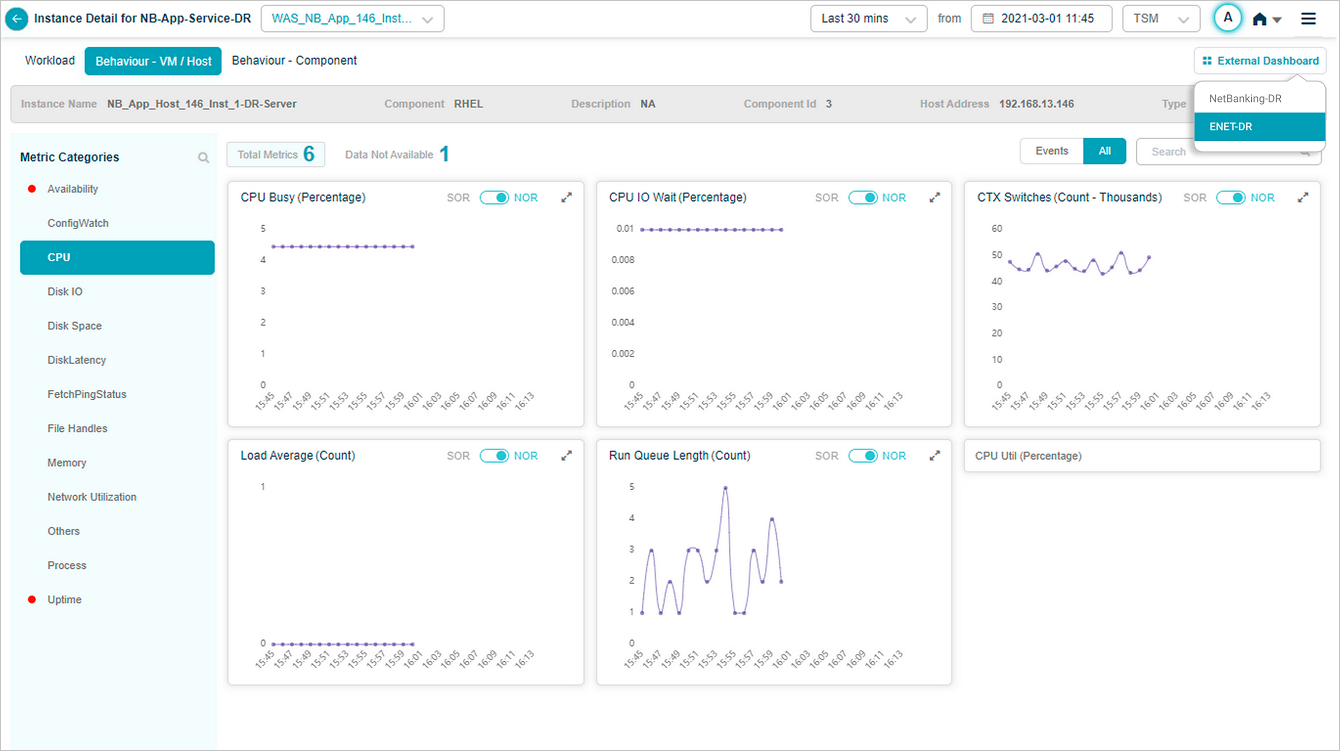
External dashboard link
If you have a Grafana dashboard for an application in HEAL, the Service Details screen shows an External Dashboard link.

Click External Dashboard to open the Grafana dashboard in a new tab. The Grafana plugin pre-selects this service. If the service belongs to several applications, a dropdown lets you pick the right Grafana dashboard.
Next
- Service Details Dashboard . high-level dashboard map.
- Application Summary . application-level drill-down.
- Navigating Signal Tab . problems and early warnings.