Search for answers or browse our knowledge base.


Availability KPIs show whether instances and ports are up or down. They apply at the instance level only and group together under one category called Availability at the top of every instance screen. Values are binary (0 or 1).
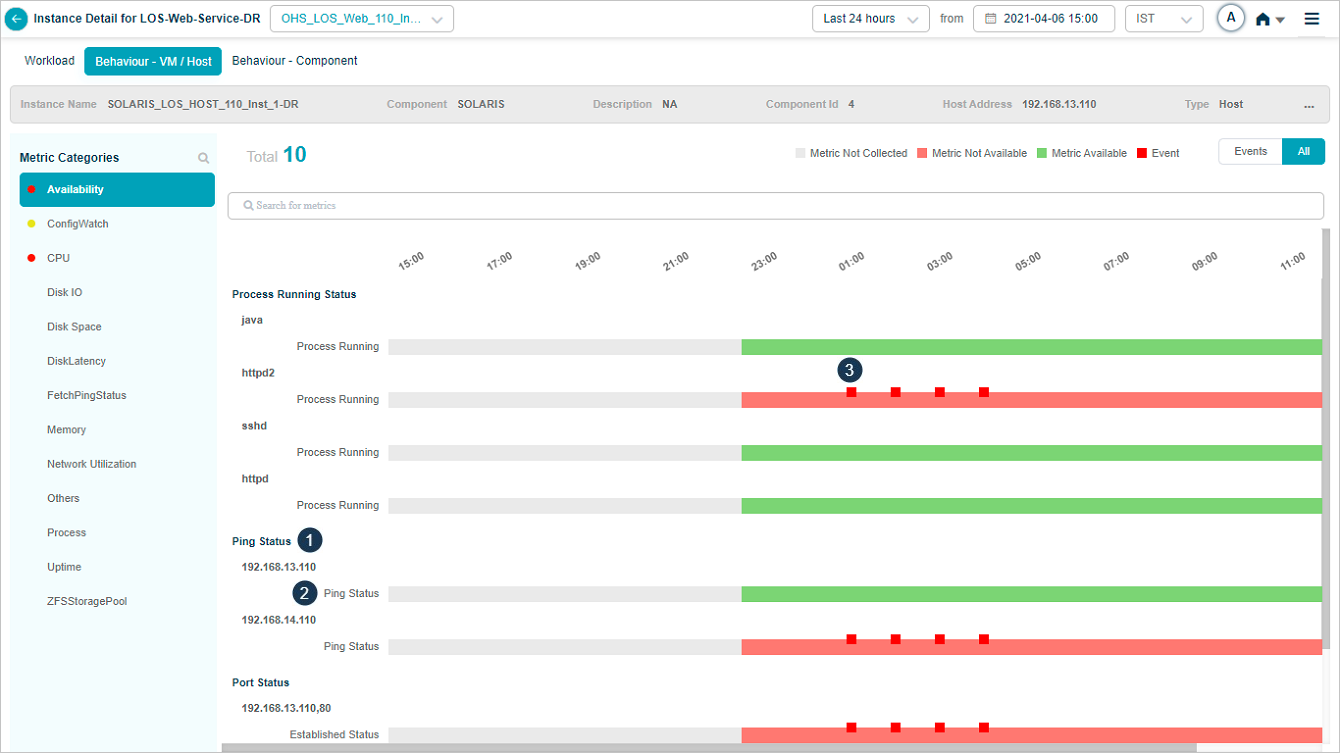
What’s on the screen
1. Group KPI. A KPI that contains other KPIs.
2. KPI under a group. One of the KPIs grouped under the parent.
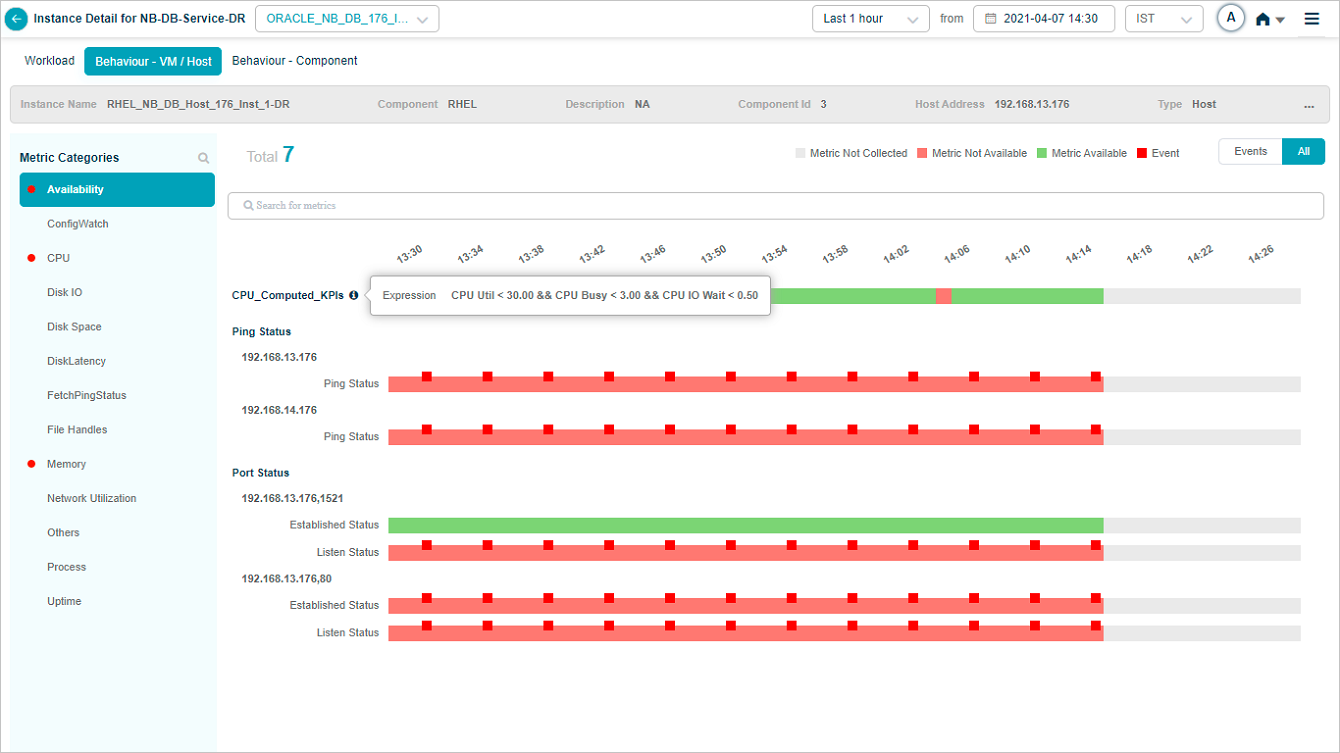
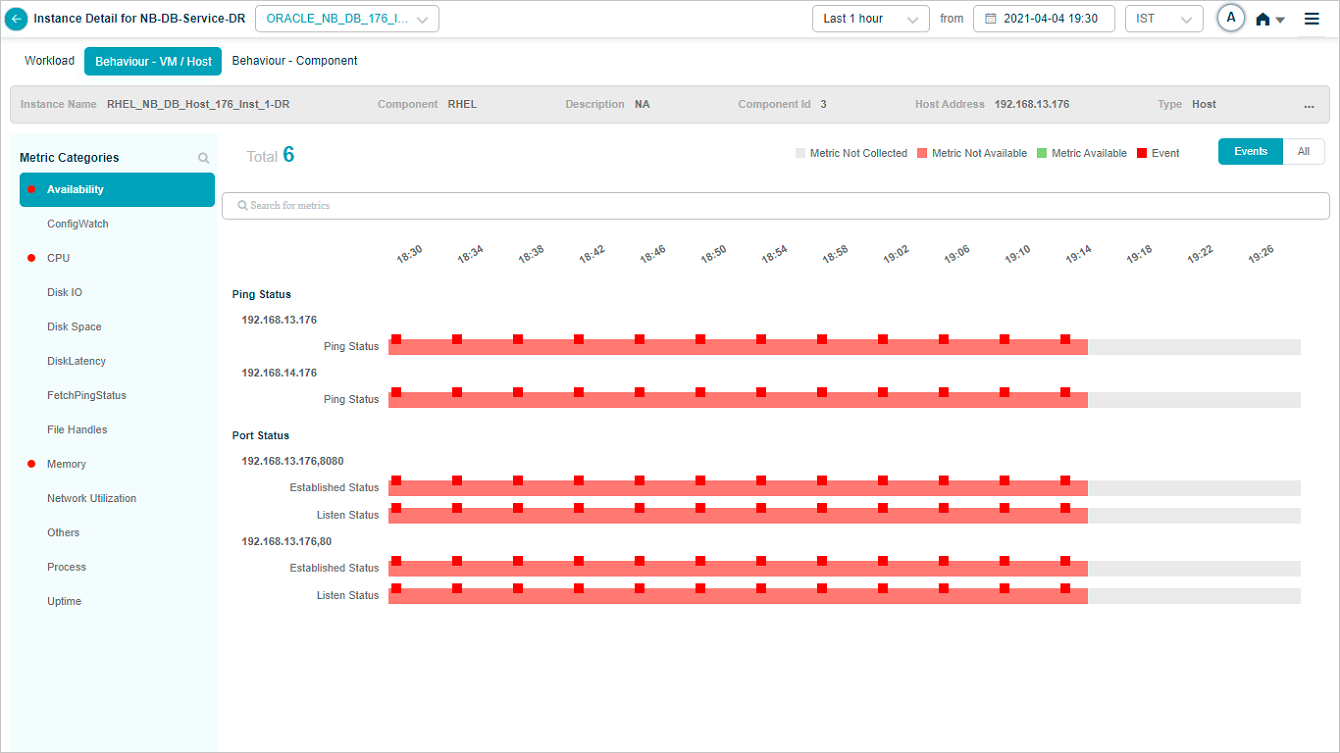
3. Status bar. Pick Events to show only KPIs that have events. The bar uses three blocks:
- Red. A KPI that is unavailable and meets the persistence or suppression rules. The block sits on top of a pink block.
- Pink. The KPI is unavailable for that time range.
- Green. The KPI is available for that time range.
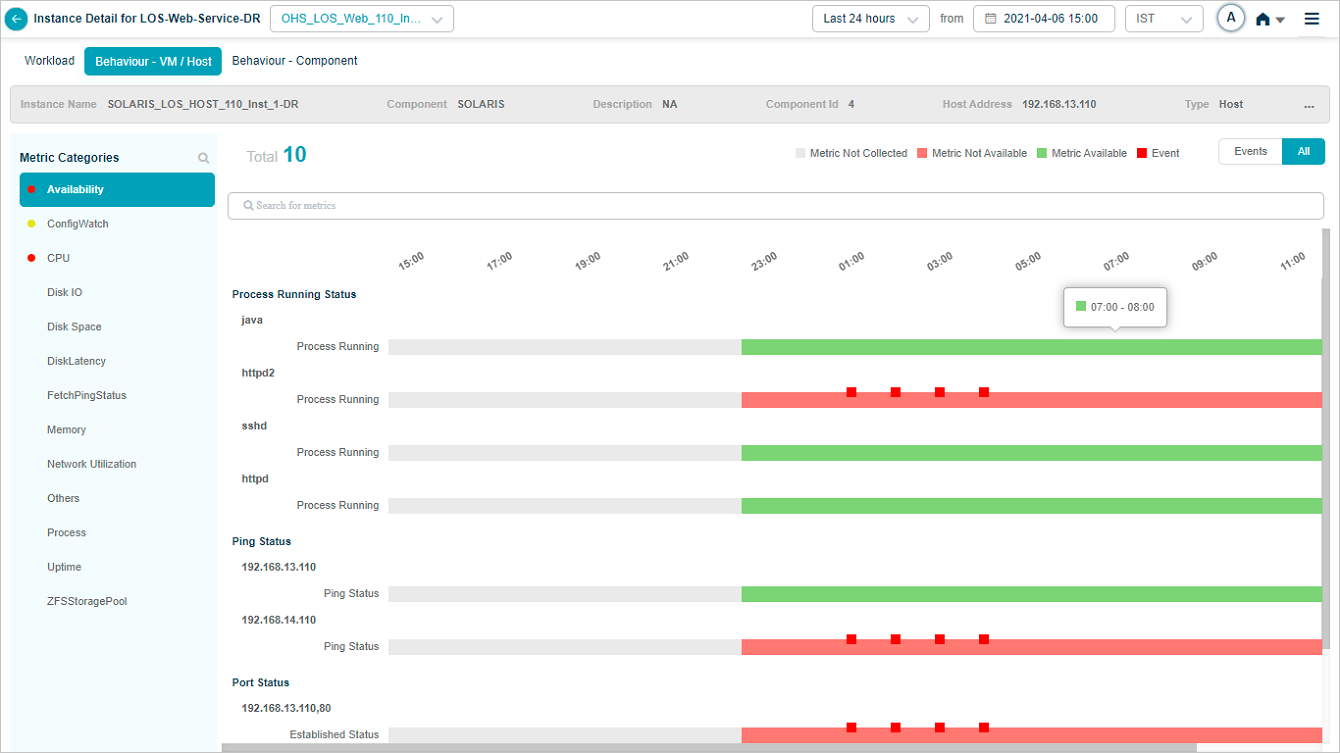
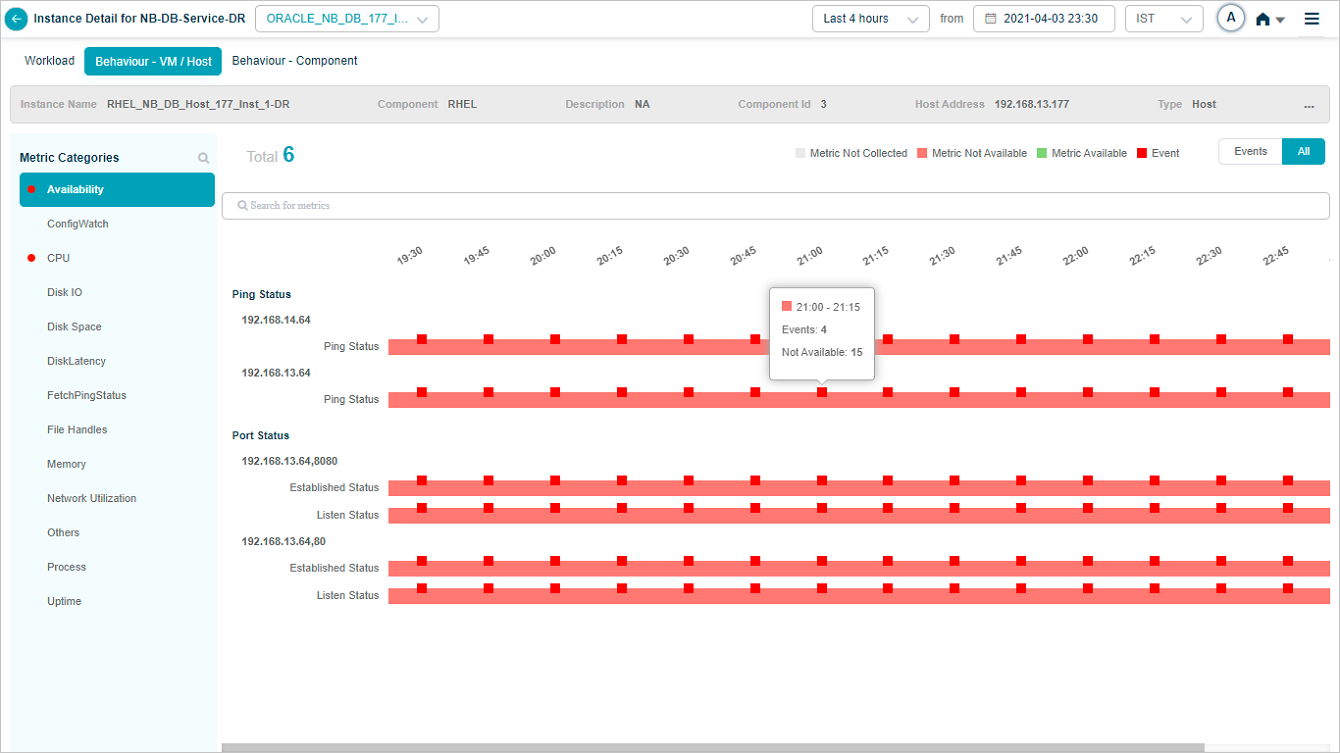
Hover details
Hover a green block to see the time interval the KPI was available.
Hover a pink or red block to see the unavailability interval, the unavailability count, and the events count for that interval.
Computed availability metrics
If you create an Availability Computed metric in the Control Center (for example, Server Availability), it shows alongside the regular availability KPIs.
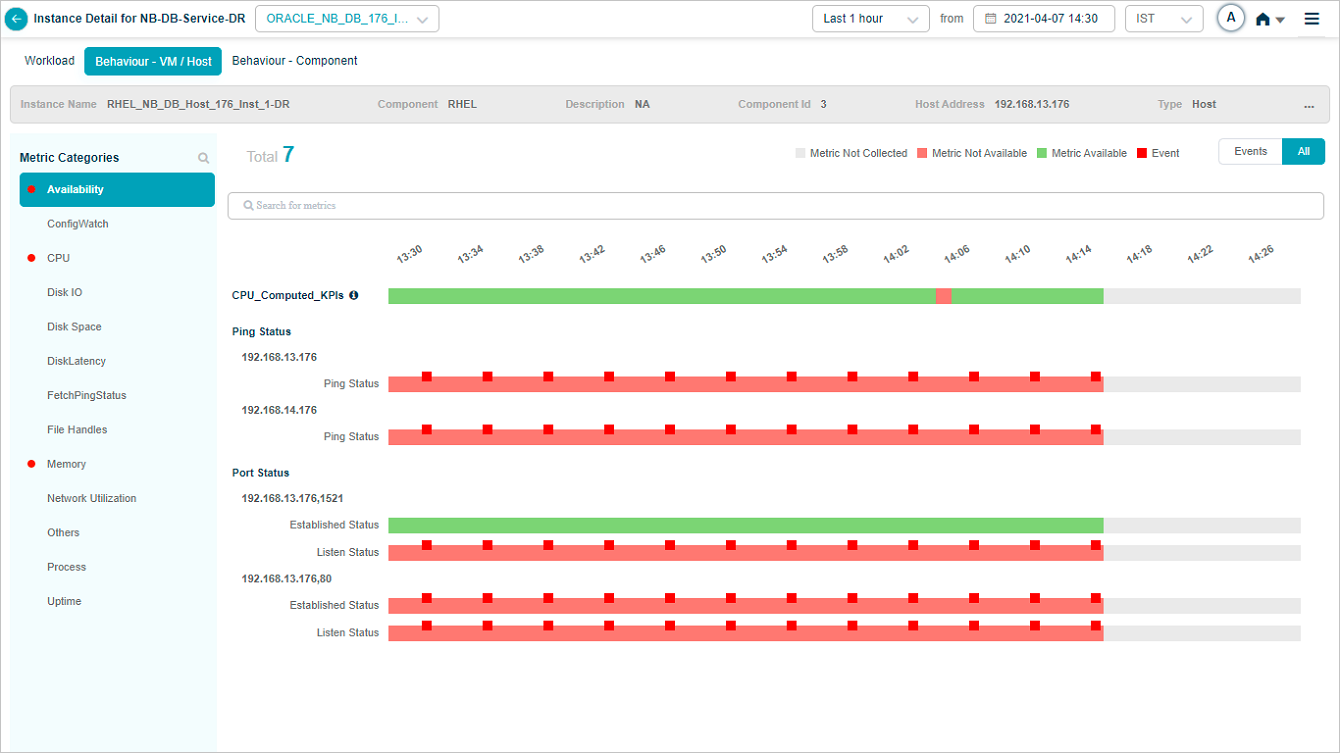
Click the information icon to see the computed metric expression.
Search for KPIs
Click the Search for metrics box, then pick the metrics you want.
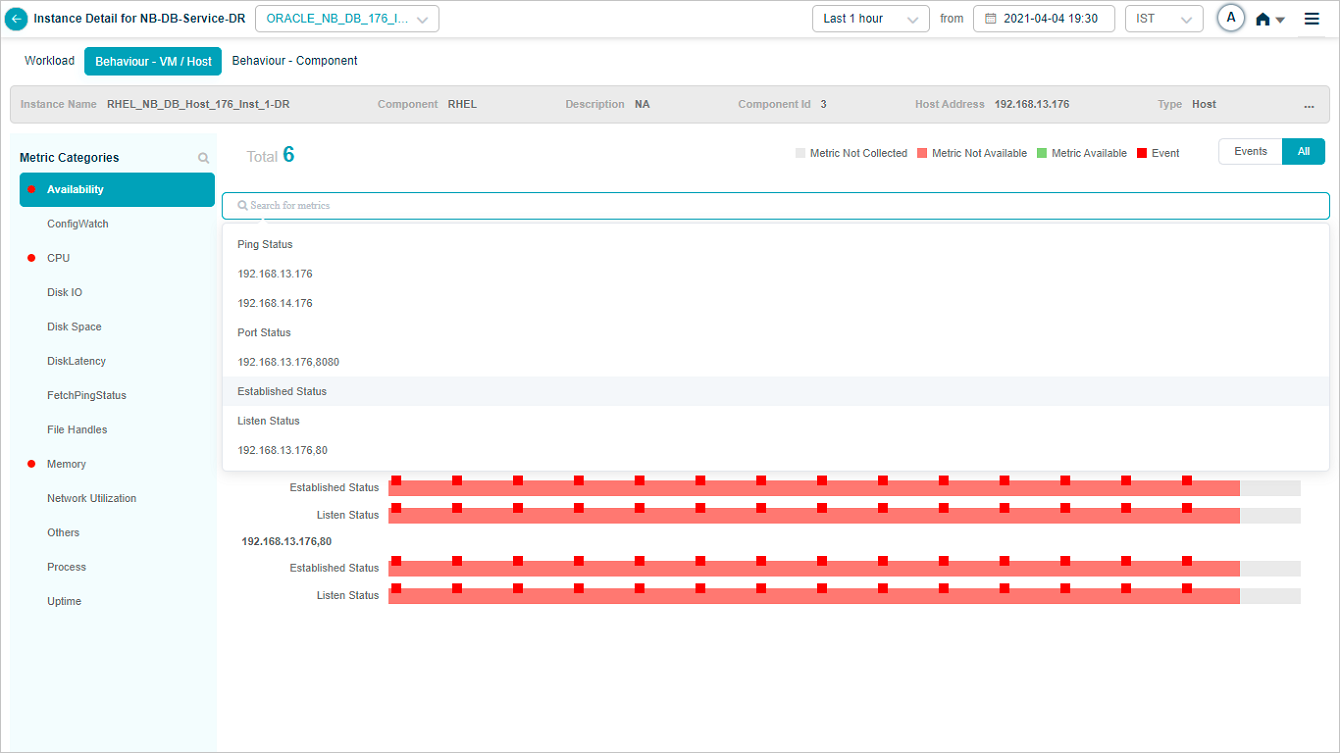
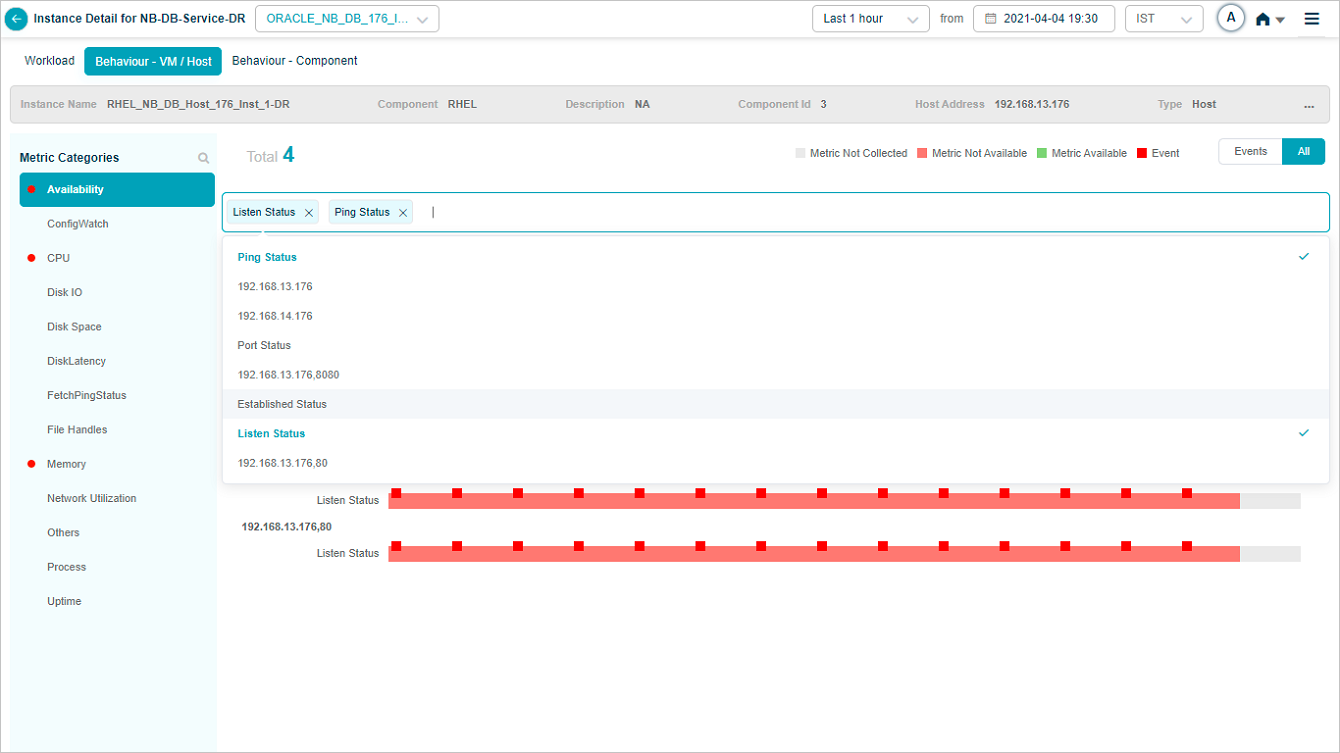
Data for the selected metrics appears.

HEAL Host Availability
This KPI publishes one value per component instance and lets you tell whether a host is up or down. Notifications fire when the Supervisor Agent goes down.
Required Supervisor Agent version.
supervisor_solaris_10_2.1.1.12supervisor_Linux_10_2.1.0.12

1. Green block. The host is available for that time range.
2. Pink block. The host is unavailable for that time range.
3. Red block. The host is unavailable and meets the persistence or suppression rules. Sits on top of the pink block.
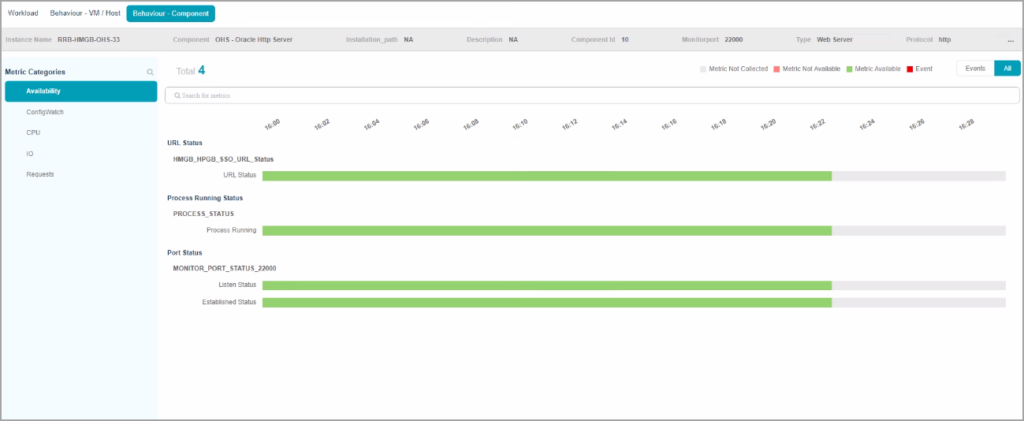
URL Availability
This KPI publishes the availability of specified URLs. Notifications fire when a URL becomes unreachable.
- Gray block. The metric was not collected for that time range.
- Green block. The URL is reachable.
- Pink block. The URL is unreachable.
- Red block. The URL is unreachable and meets the persistence or suppression rules.
Sample components with availability KPIs
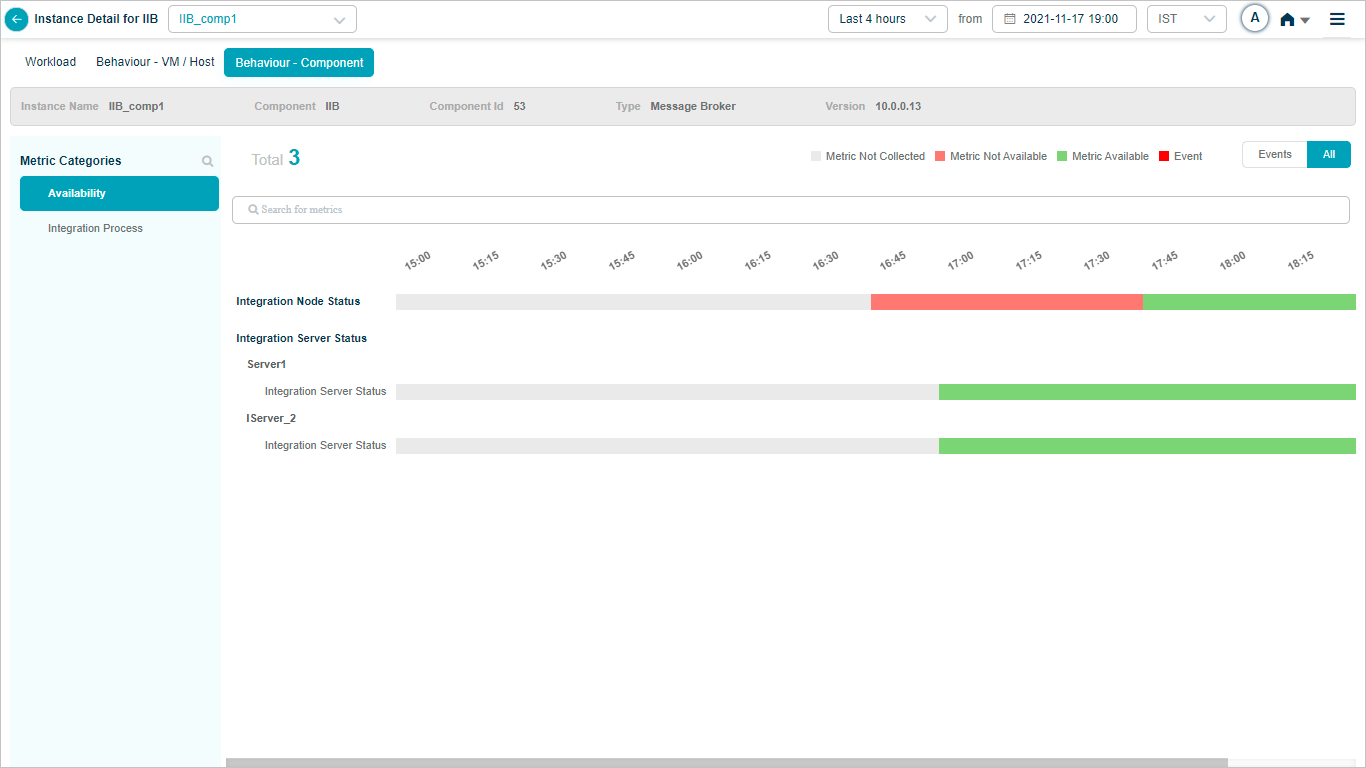
IIB
Map IIB component instances to IIB components in the Control Center to see IIB availability KPIs. Integration Node Status shows whether the IIB node is active. Integration Server Status shows whether the server is up.


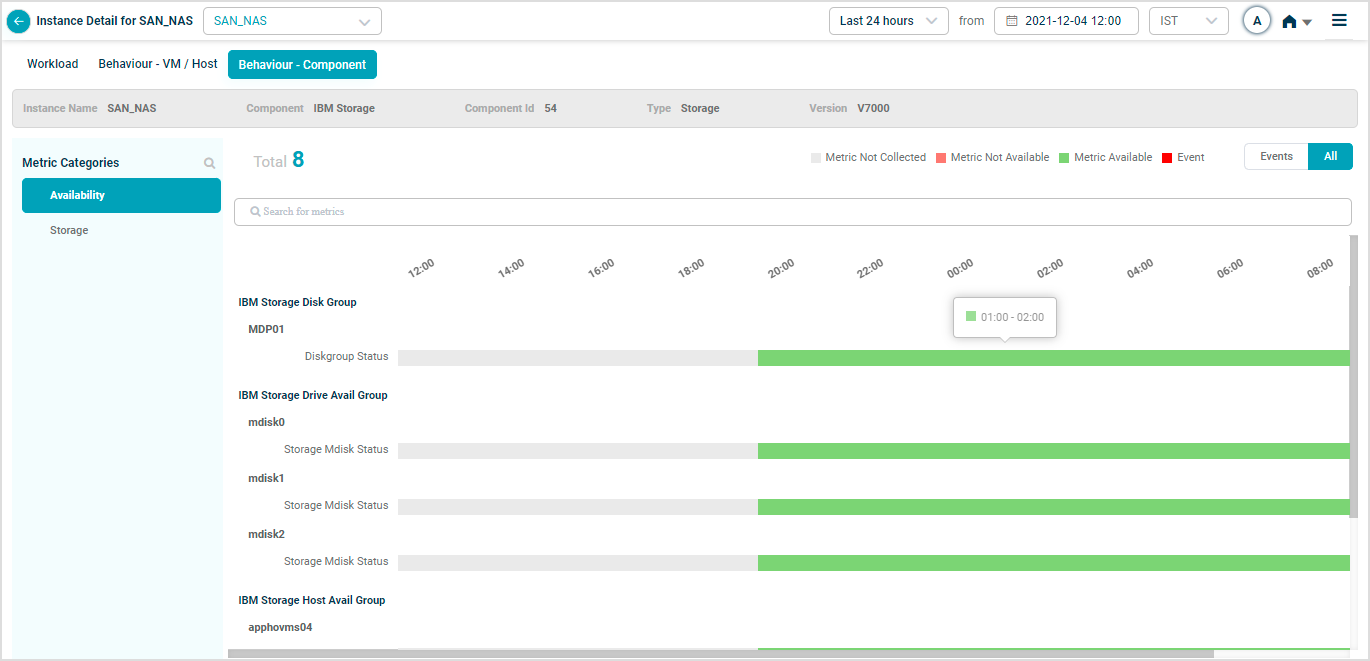
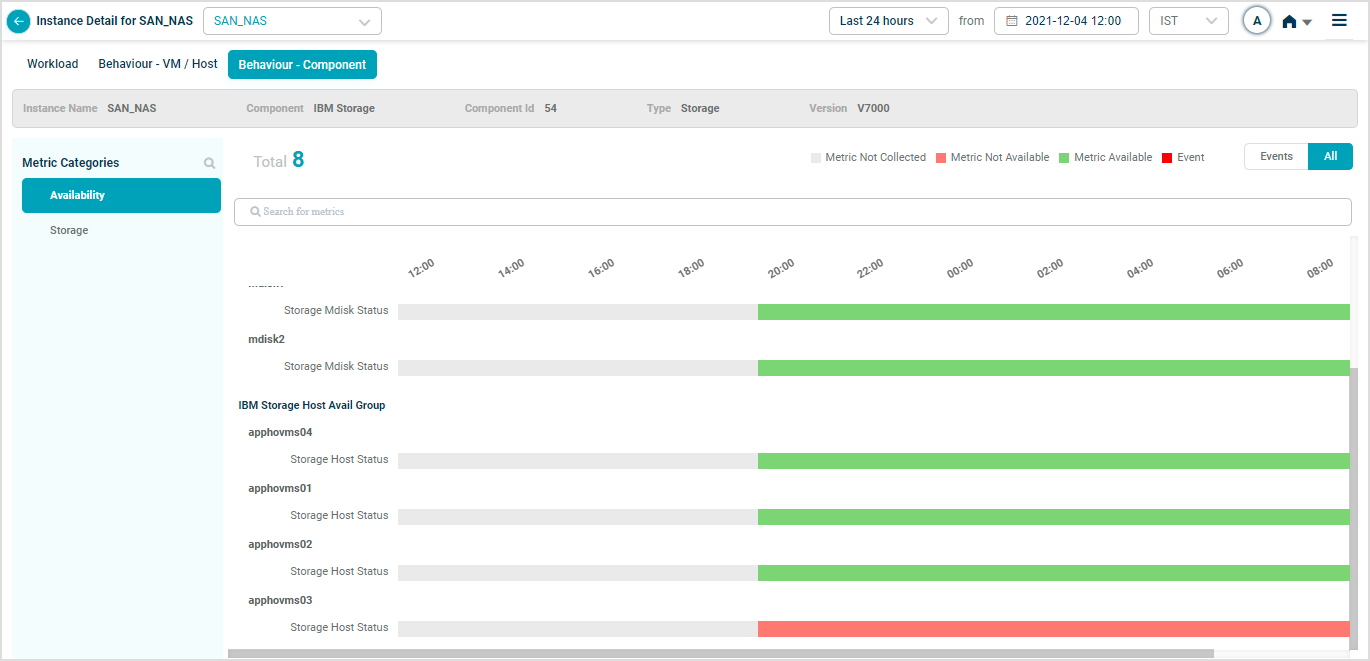
IBM Storage
Map SAN_NAS instances to the IBM Storage component in the Control Center to see IBM Storage availability KPIs. The Disk Group, Drive Avail Group (Mdisk), and Host Avail Group KPIs cover those components.
Next
- Viewing Application Health . the application-level dashboard.
- Viewing Request Dashboard . workload request details.
- HEAL Health KPIs . monitor the HEAL platform itself.