Search for answers or browse our knowledge base.


The Application Summary screen shows the health of one application, the services it talks to, and any active problems or warnings. It is the drill-down from the Application Health Dashboard.
What you can do here
- Watch application health and performance in one screen.
- See the Service Dependency Map (SDM) with external entities, services, and adjacent applications.
- Read service health from event capsules at a glance.
- Open active problems, warnings, and capacity forecasts.
- Search, customize the layout, and review historical data.
Open the Application Summary
In the Application Health Dashboard, click any application pod to open its Application Summary.
What’s on the screen
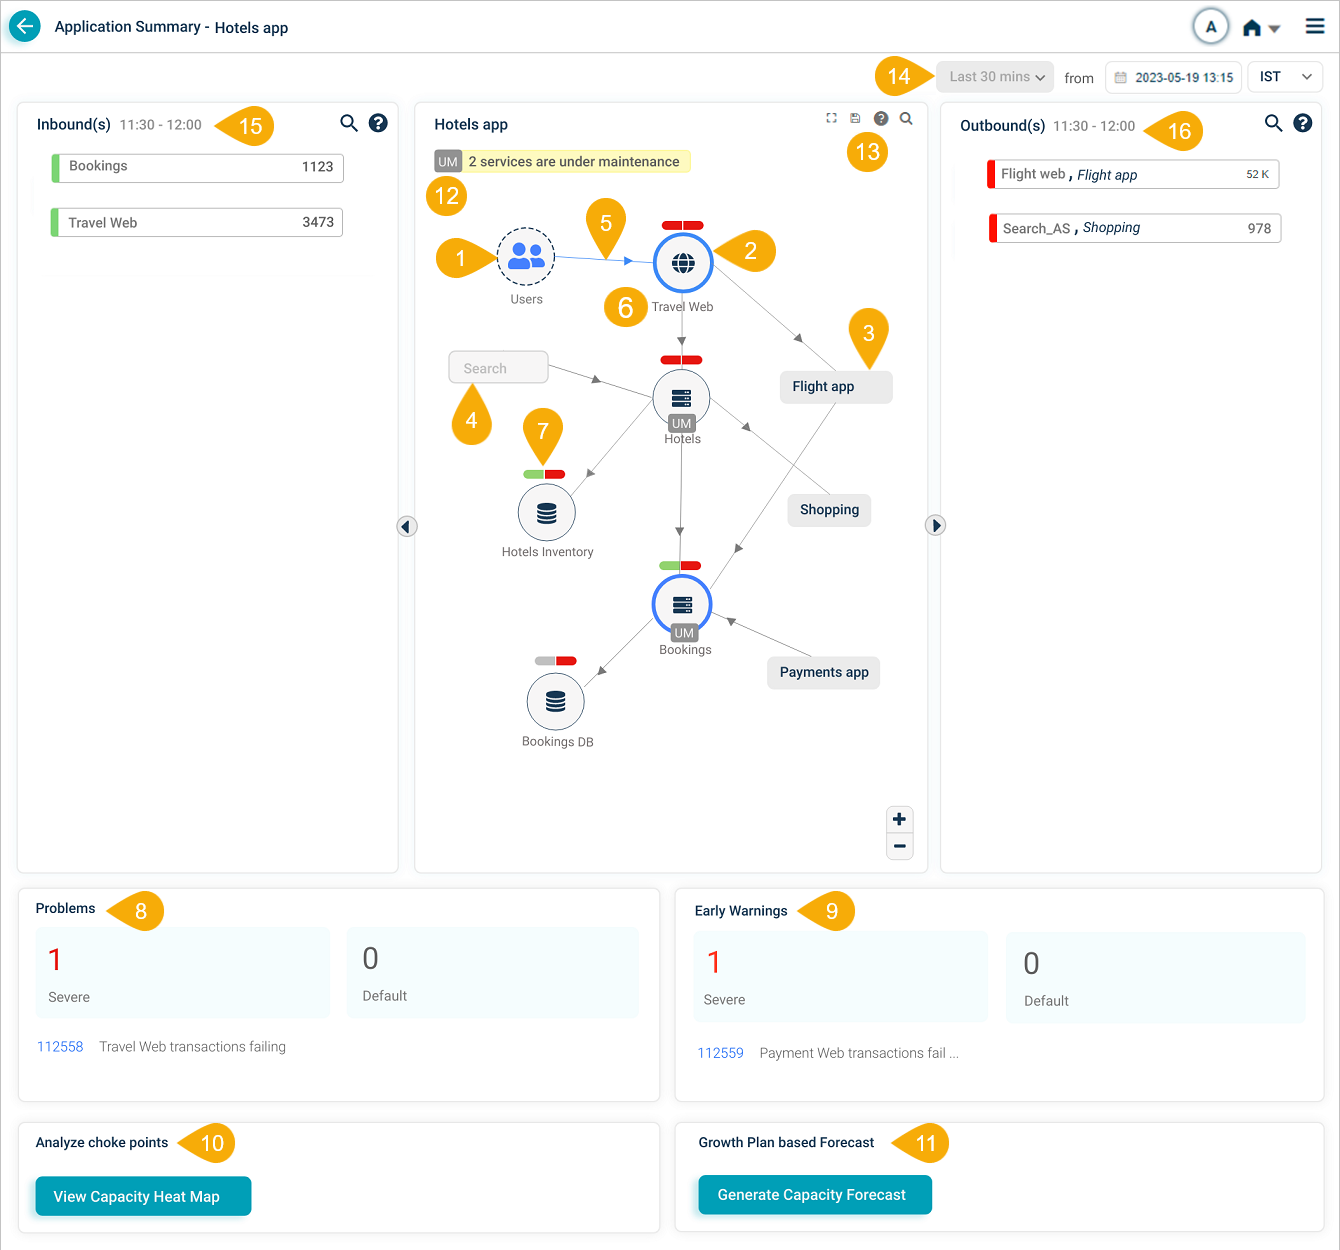
1. External entity. An external user or service that starts a transaction in the application.
2. Entry-point service. The service that takes the request from the external source. Useful for spotting primary interaction points and shared services.
3. Adjacent application. A related application one hop away. Click any adjacent application you have access to and you can open its own Service Dependency Map.
4. Restricted application. An application your role cannot open.
5. Inbound traffic indicator. Marks a service receiving requests or data from an external source.
6. Host and component instances. The total count of host and component instances behind a service.
7. Event capsules. Each service shows a two-part capsule. Left half is workload KPI health, right half is behavior KPI health. Colors:
- Green. No events on the service.
- Red. Events on the service.
- Gray. The service is not being monitored.
8. Problems. Count, IDs, and descriptions of active Severe and Default problems in the selected time range. Click any problem to open it in the Signals tab.
9. Early warnings. Count, IDs, and descriptions of active early warnings. Click any to open it in the Signals tab.
10. View Capacity Heat Map. Open transaction trends to find growth patterns and the workload mixes causing the most anomalies. See Viewing Capacity Heat Map.
11. Generate Capacity Forecast. Build a trend-forecast report from the growth pattern of transactions over the selected period. See Generating Capacity Forecast.
12. Maintenance service count. Number of services currently under maintenance. Services in maintenance show a UM icon. Maintenance can be applied to the whole service or to specific instances.
13. SDM toolbar. The Service Dependency Map auto-discovers hosts and services to draw a real-time picture of the application. The toolbar has these controls:
- Fit the SDM on the page after zooming.
- Search by service name (full or partial).
- Save the layout.
14. Historical data selection. Pick a date, time, and time zone to look at past performance.
15. Inbound(s). Transactions hitting the entry-point services.
16. Outbound(s). Transactions leaving the application.
Next
- Service Details Dashboard . per-service drill-down.
- Navigating Signal Tab . problems and early warnings.
- Viewing Capacity Heat Map . workload trends and forecasts.