Search for answers or browse our knowledge base.


Generate a Capacity Forecast for an application by picking a workload mix and entering a growth plan. The forecast shows how the application’s capacity KPIs will trend at the projected volume.
Open the forecast generator
1. Open the Application Summary page. See Application Summary.
2. Click Generate Capacity Forecast in the Growth Plan-Based Forecast section.
What’s on the screen
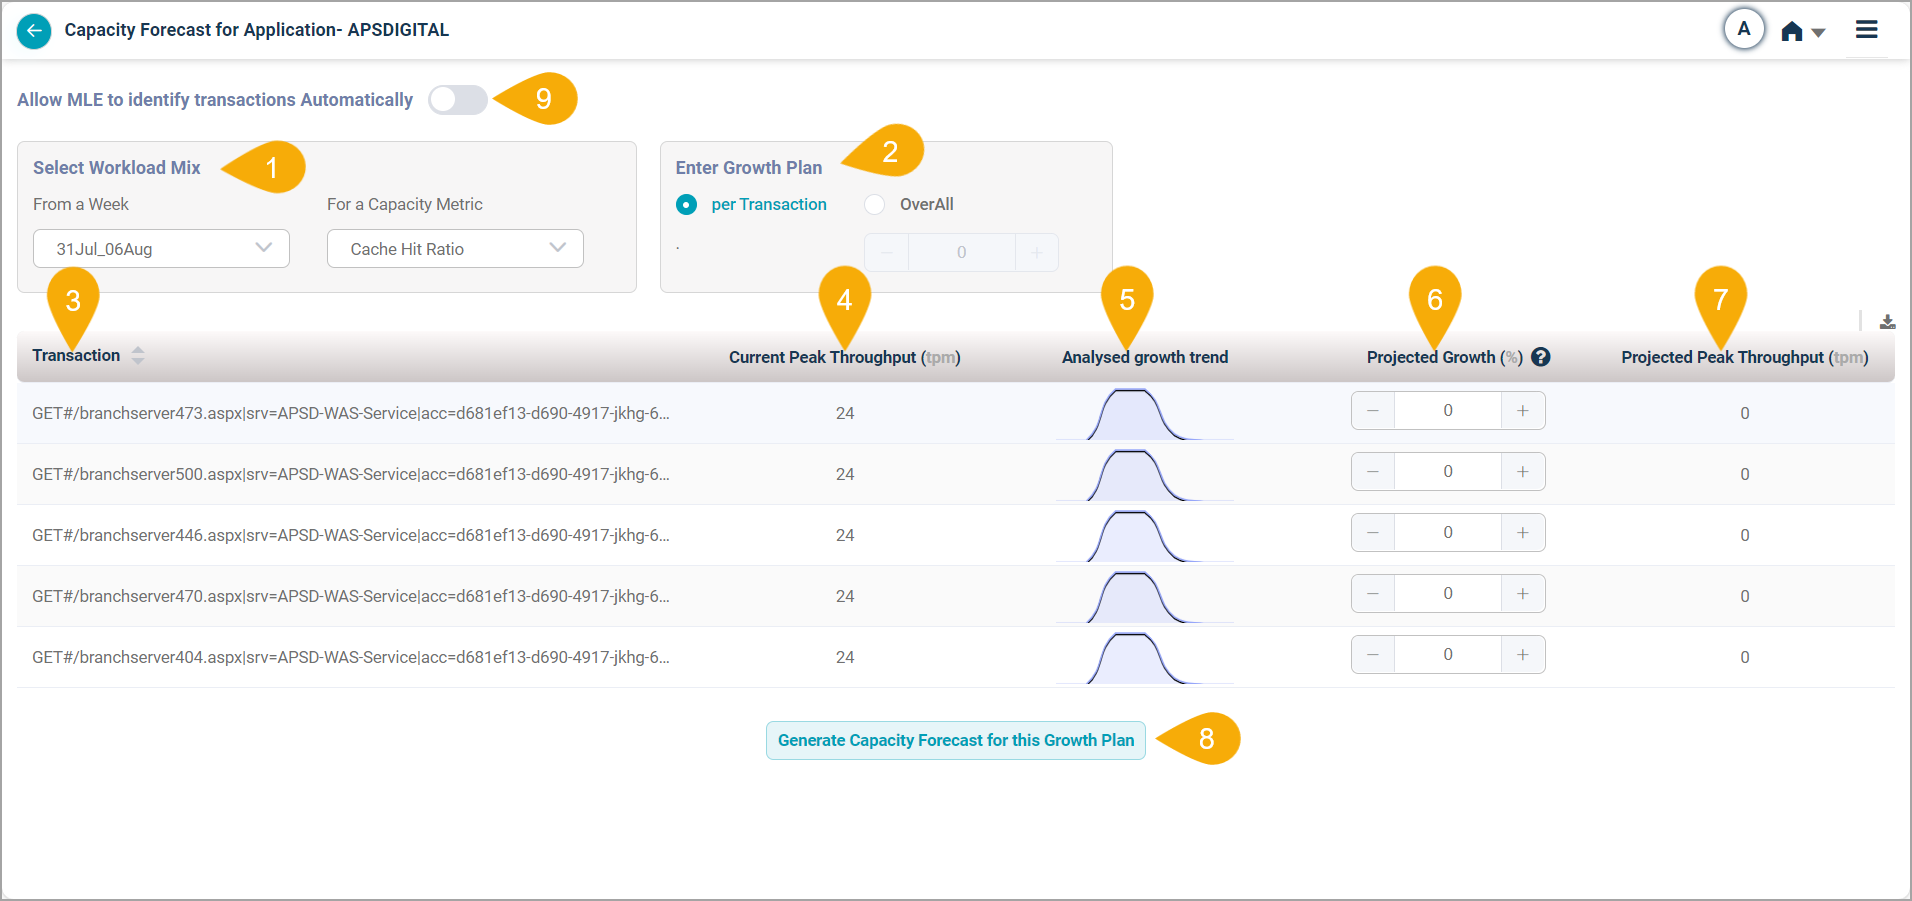
1. Select Workload Mix. Two ways to build the mix:
- From a Week. Lists the top “taxing” transactions for the selected week.
- For a Capacity Metric. Lists the top transactions putting the most stress on the selected Capacity KPI.
2. Enter Growth Plan. Enter a growth plan for any listed transaction, or set an overall percentage increase for all transactions.
3. Transaction. The list updates based on the selected Workload Mix. If workload data is unavailable, you see the instances in the transactions instead.
4. Peak Throughput. The highest transaction volume in the analyzed period.
5. Analysed Growth Trend. A sparkline of the daily volume of each transaction for the selected week.
6. Growth Plan. A slider that goes up to 1000 percent.
7. Projected Peak Throughput. Calculated from the current volume and the projected percentage increase.
8. Generate Capacity Forecast. Click Generate Capacity Forecast for this Growth Plan to load the heat map.
9. Allow MLE to identify transactions automatically. Switch on to let the MLE classify and pick transactions for you.
Generate the forecast
1. Click Generate Capacity Forecast for this Growth Plan. The Capacity Forecast heat map loads at the bottom of the screen.
Download the forecast
Click the download icon to save the details as an XLSX file with these columns:
- Transaction
- Current Peak Throughput (tpm)
- Analysed Growth Trend
- Projected Growth (%)
- Projected Peak Throughput (tpm)

KPI in the heat map
Hover any KPI in the heat map to see:
- Instance Name. The instance the KPI is for.
- KPI Name. The metric name.
- Current Value. The current value of the metric.
- Projected Value. The projected value at the planned growth.
- Projected Peak Throughput (tpm)

MLE automatic transaction trend prediction
By default, the Allow MLE to identify transactions automatically slider is off, so you set the transaction volume yourself in the Projected Growth column.
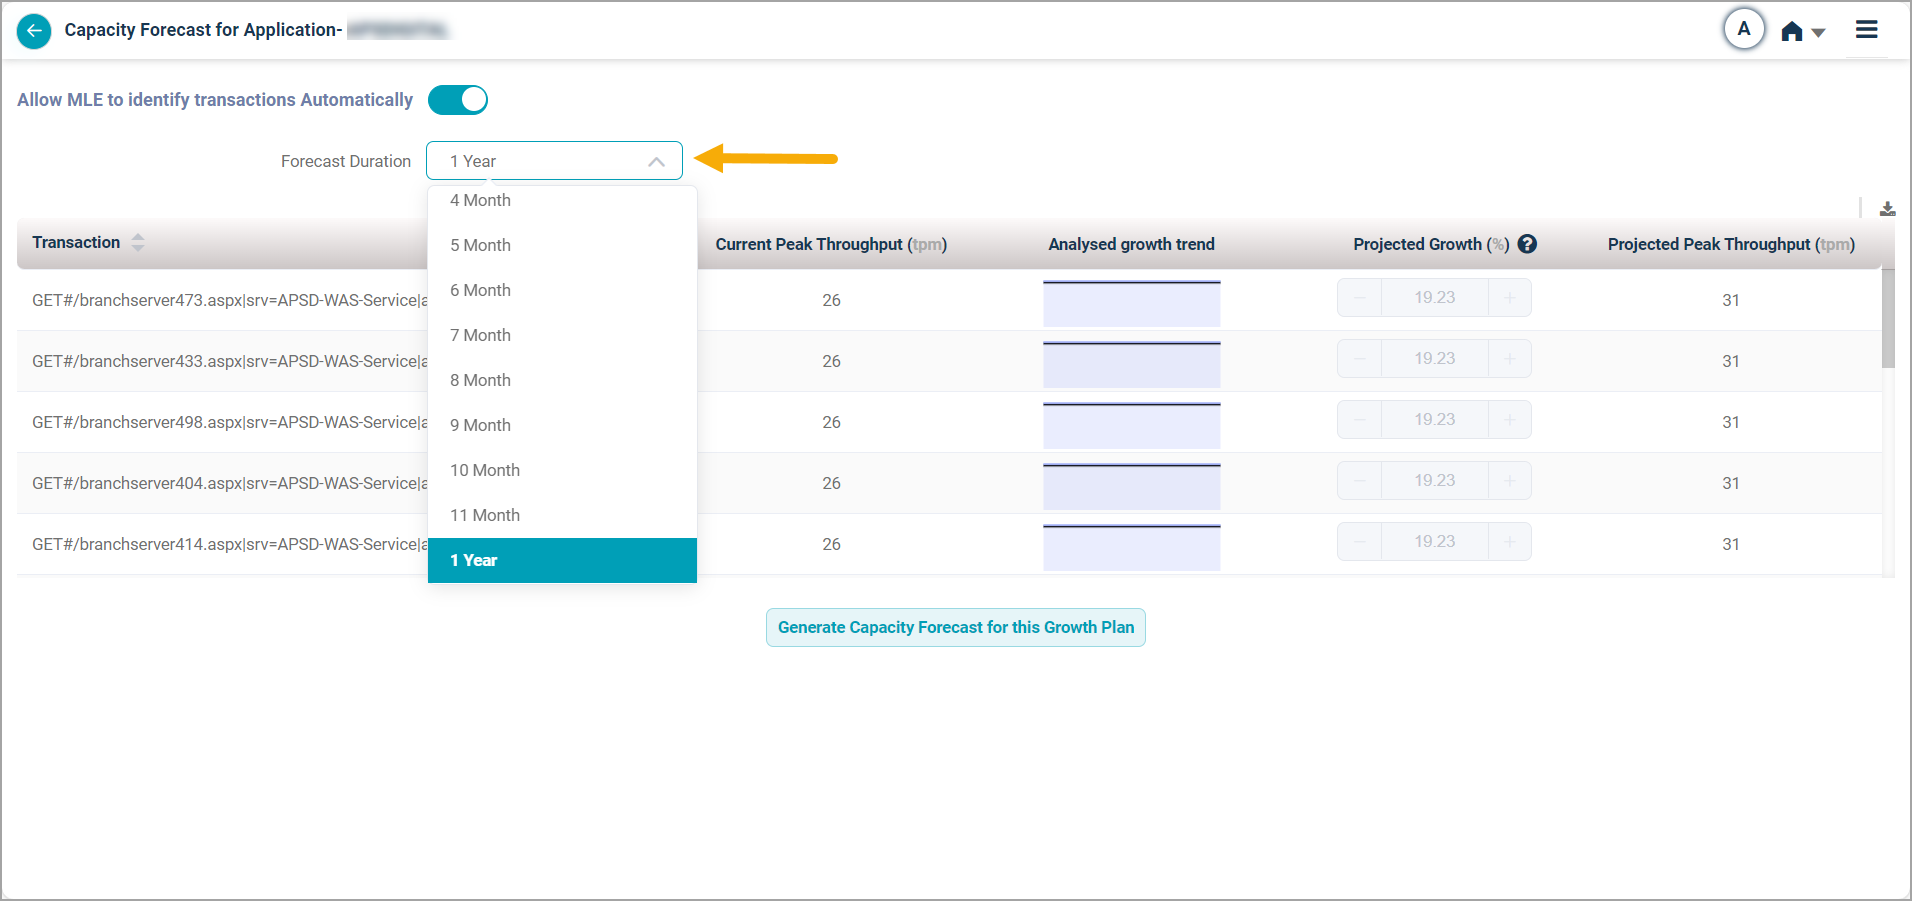
Switch the slider on and the MLE predicts the transaction trend for you and forecasts the Peak Throughput automatically.
Projected growth formula.
Forecast duration
- On the Capacity Forecast screen, open the Forecast Duration dropdown.
- Pick a duration up to 1 year.
- The MLE predicts the percentage growth for the transaction from historical trends, scaled to the duration you selected.
Next
- Viewing Capacity Heat Map . weekly capacity trend.
- Capacity Forecasting . full feature walkthrough.
- Benefits and Features . why this matters.