Search for answers or browse our knowledge base.


HEAL Mobile Application Monitoring tracks the performance of your Android and iOS apps. The dashboard breaks down transactions, response times, and per-service stats so you can spot reliability and performance issues fast.
Transaction breakup
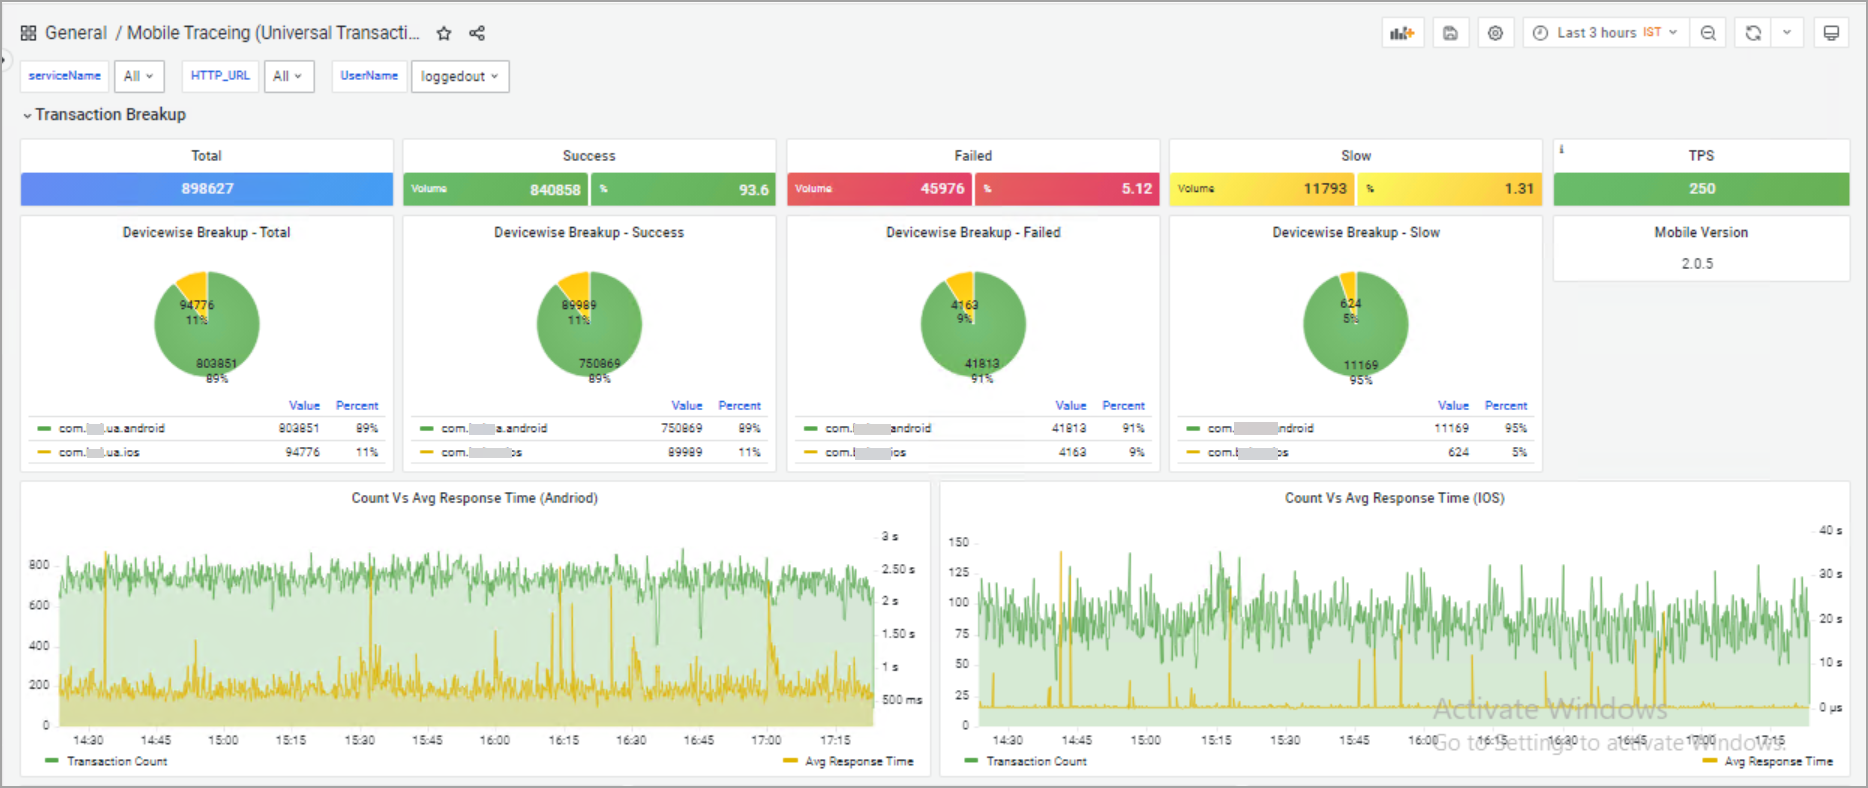
Total. All transactions in scope.
Success. Transactions that completed without errors. Tracks app reliability.
Failure. Count and percentage of transactions that did not complete as expected.
Slow. Transactions that exceeded the response-time threshold.
Count vs Avg Response Time (Android and iOS). Two graphs comparing transaction count to average response time over time, one per platform.
Top 5 transactions
Three donut charts under Transaction Breakup show the top five transactions for each metric.
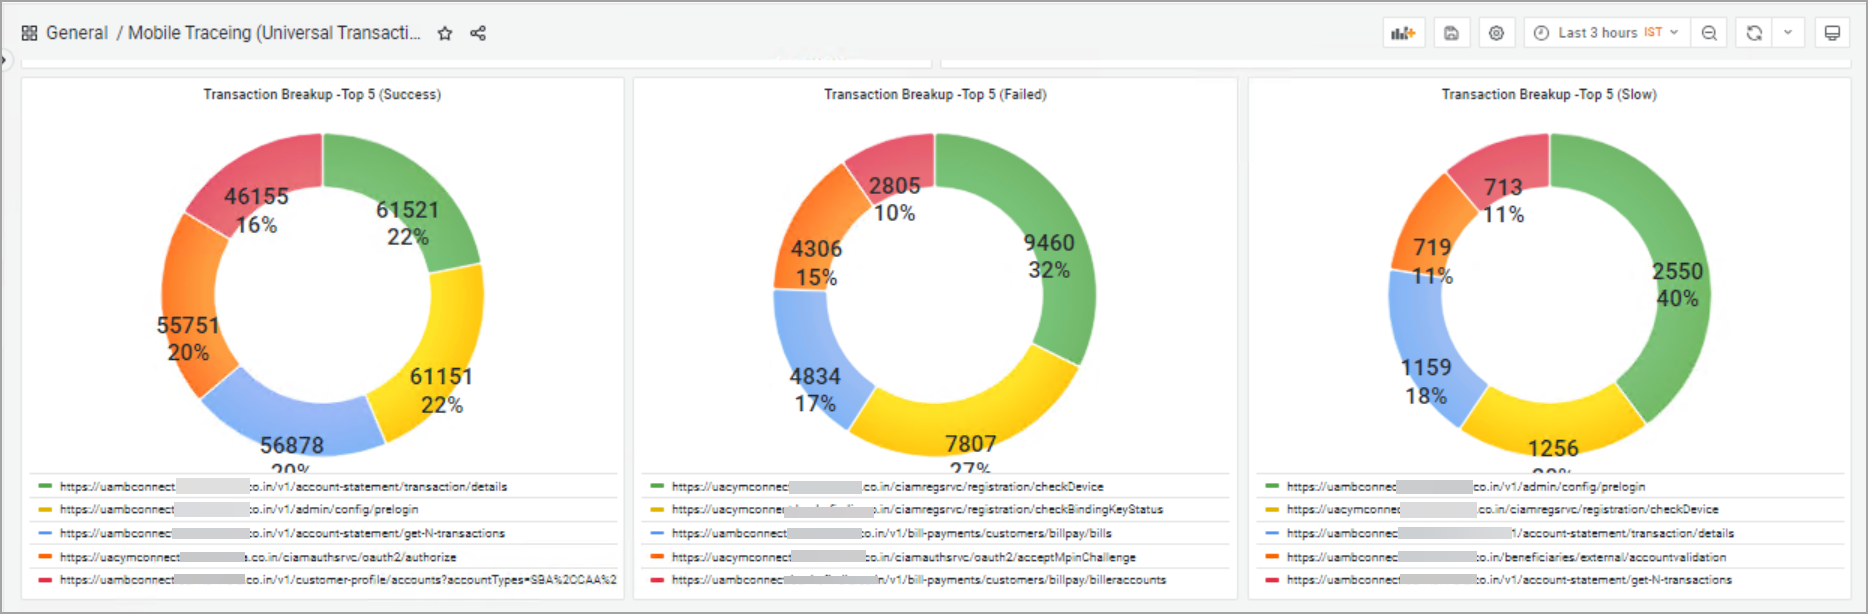
Top 5 Success. The five most successful transactions. Each segment shows the percentage contribution and an average response time in seconds.
Top 5 Failed. The five worst failures. Each slice shows the failure rate for that URL or service endpoint.
Top 5 Slow. The five slowest transactions. Each segment shows their share of total slowness with the average response time in seconds.
Service-wise transaction stats
A per-URL table with detailed transaction stats.
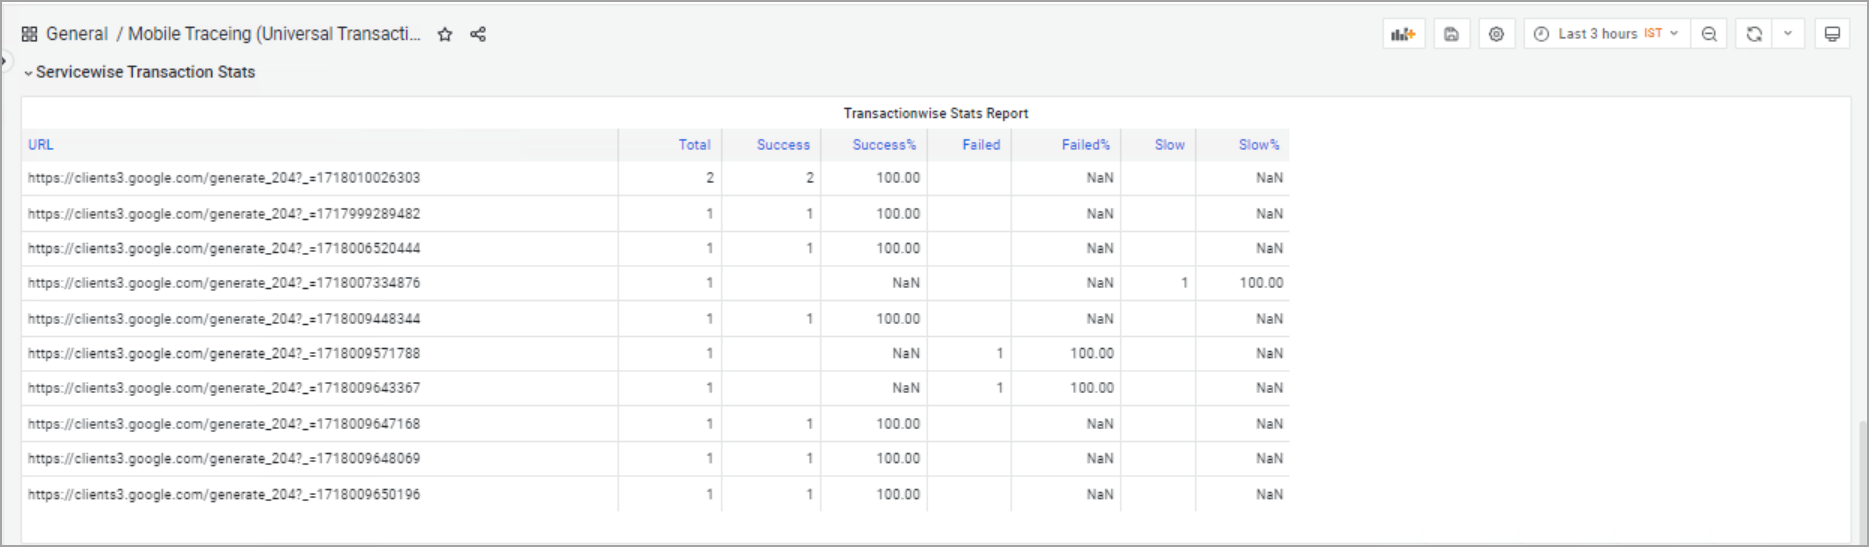
URL. Endpoint or service URL (for example, registration, authorization, investments).
Total. Total transactions for the URL.
Success. Successful transactions for the URL.
Success%. Successful transactions as a percentage of total. Reliability indicator per endpoint.
Failed. Failed transactions per URL.
Failed%. Failure rate as a percentage. NaN means there were no failures for that URL.
Slow. Transactions slower than the threshold for that URL.
Slow%. Slow transactions as a percentage of total. Useful for finding performance bottlenecks.
Application traces
The HTTP Requests Overview lists individual HTTP requests, successful or otherwise. Use it to diagnose specific issues in the app.
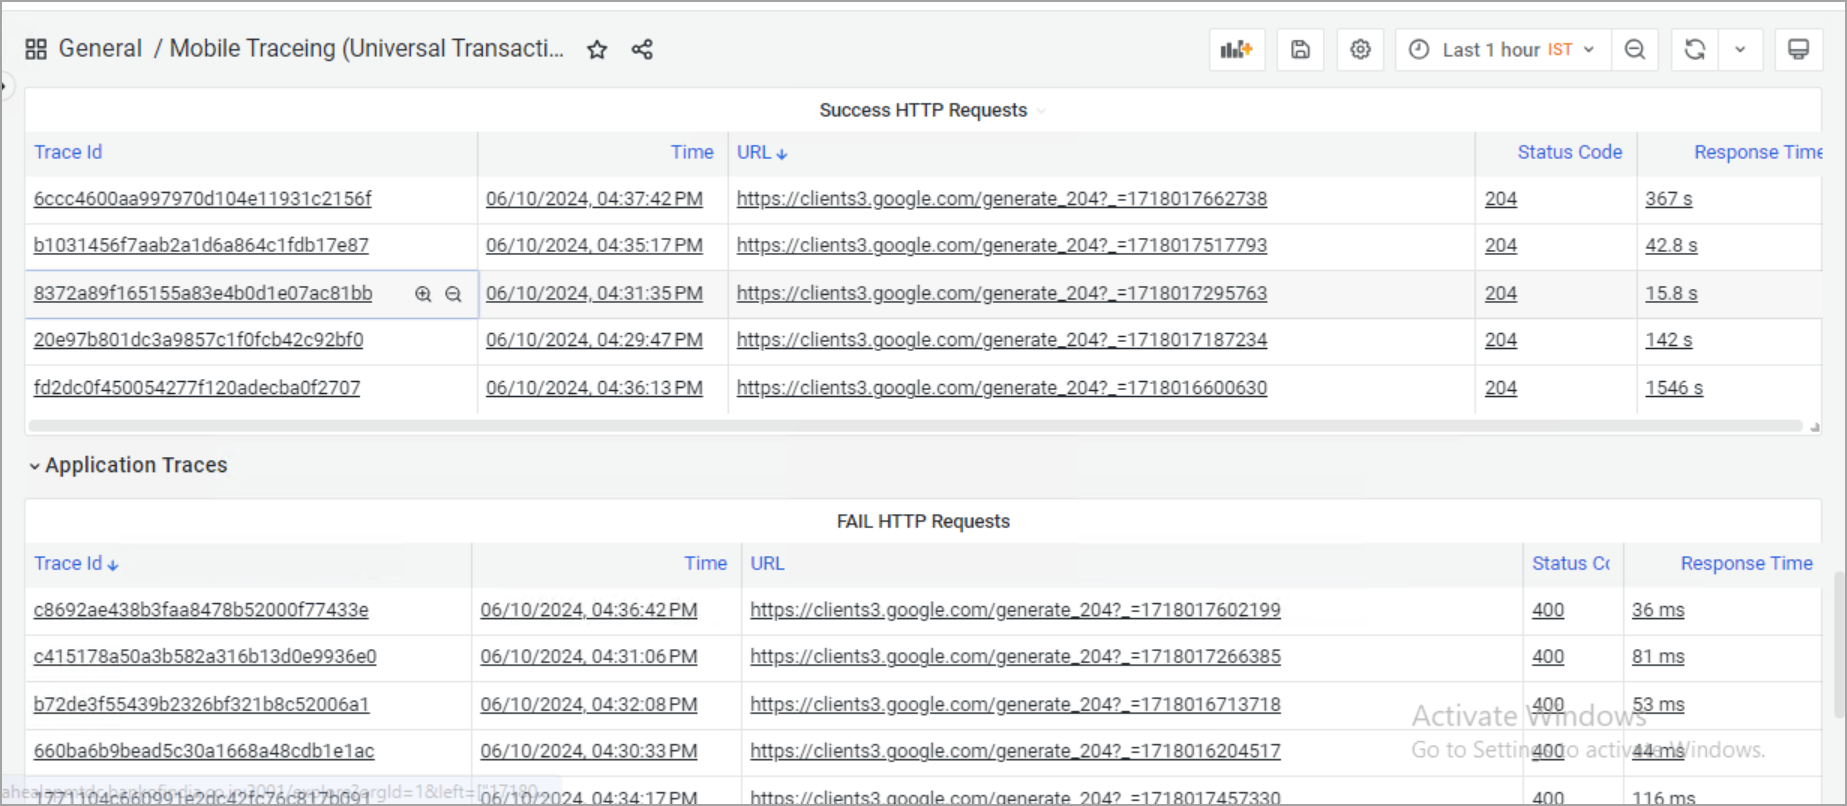
Trace ID. Unique identifier for the trace.
Time. When the trace was recorded.
URL. Endpoint that was called.
Status Code. HTTP status code (200 for success, 4xx and 5xx for various errors).
Response Time. Time the transaction took, usually in milliseconds.
Next
- Viewing Application Health . the application-level dashboard.
- Viewing Request Dashboard . workload request details.
- Transactions Audit Data and Reports . inspect transaction headers.