Search for answers or browse our knowledge base.


Capacity Forecasting predicts resource usage trends and infrastructure needs from historical behavior. You can forecast manually with your own growth assumptions or let the Machine Learning Engine (MLE) do it for you.
Capacity Trend
Use the Capacity Trend page to see historical service behavior and usage trends.
1. Open Capacity Planning > Capacity Trend.
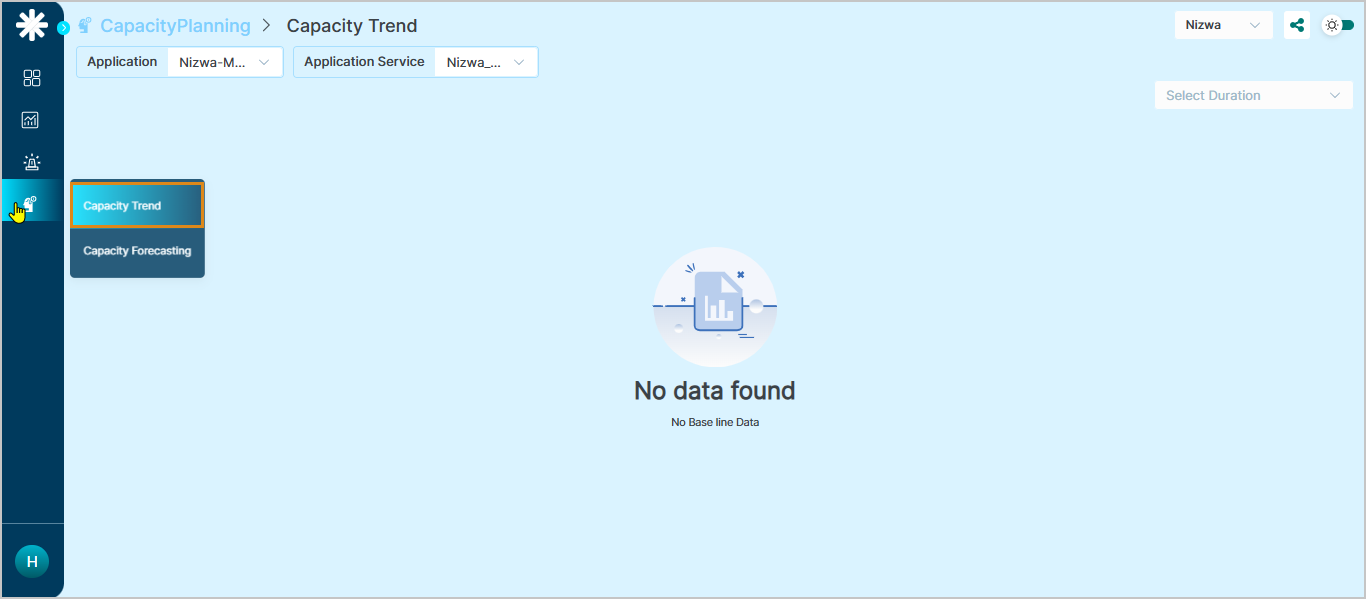
2. Pick the Application, Service, and Duration.
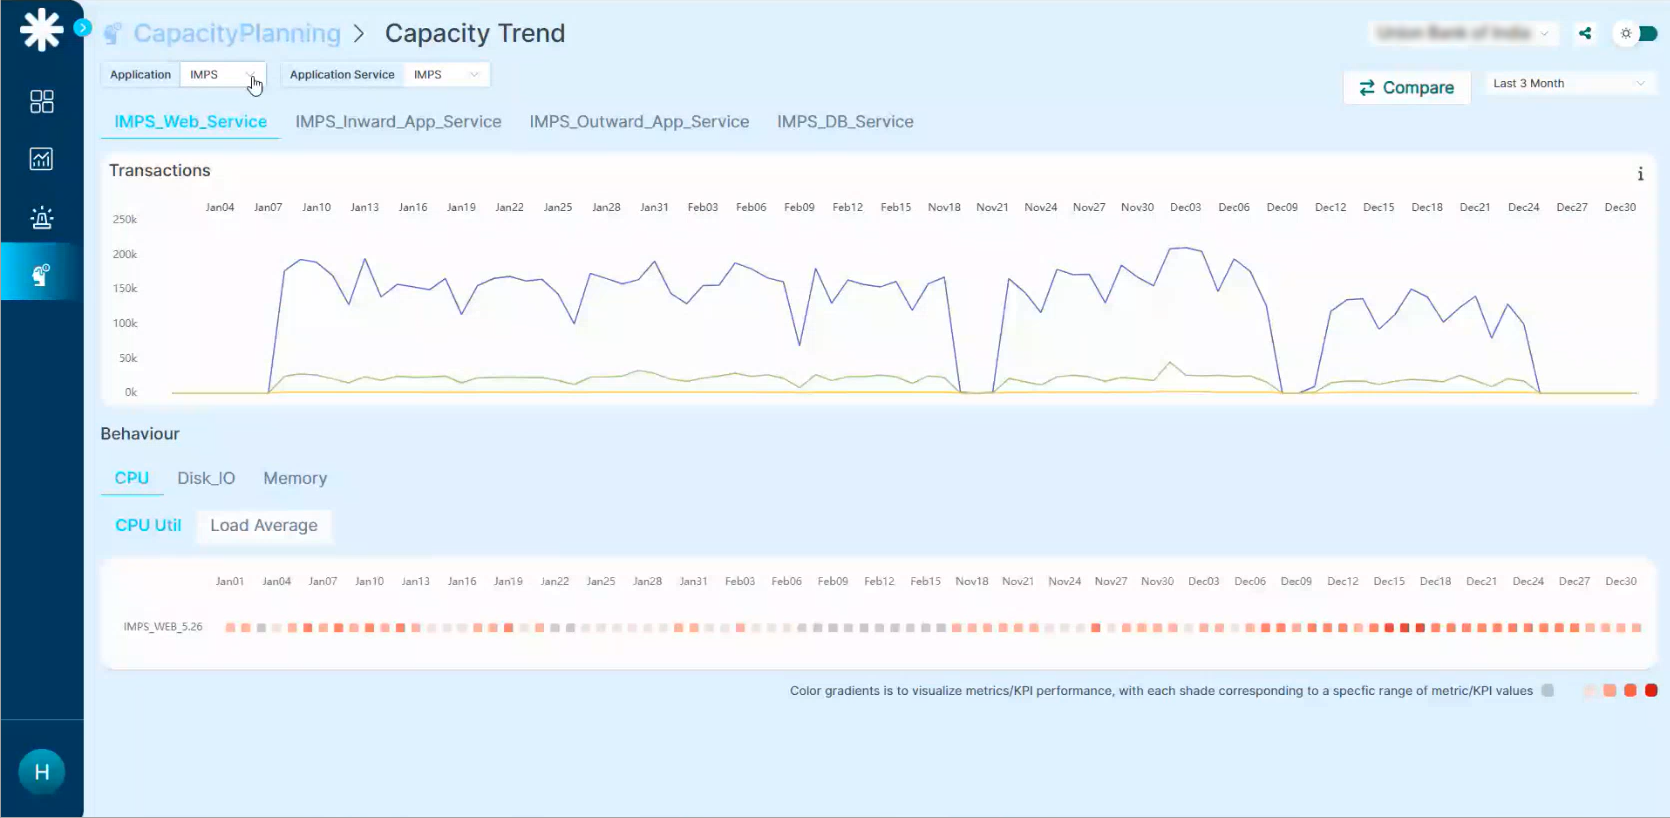
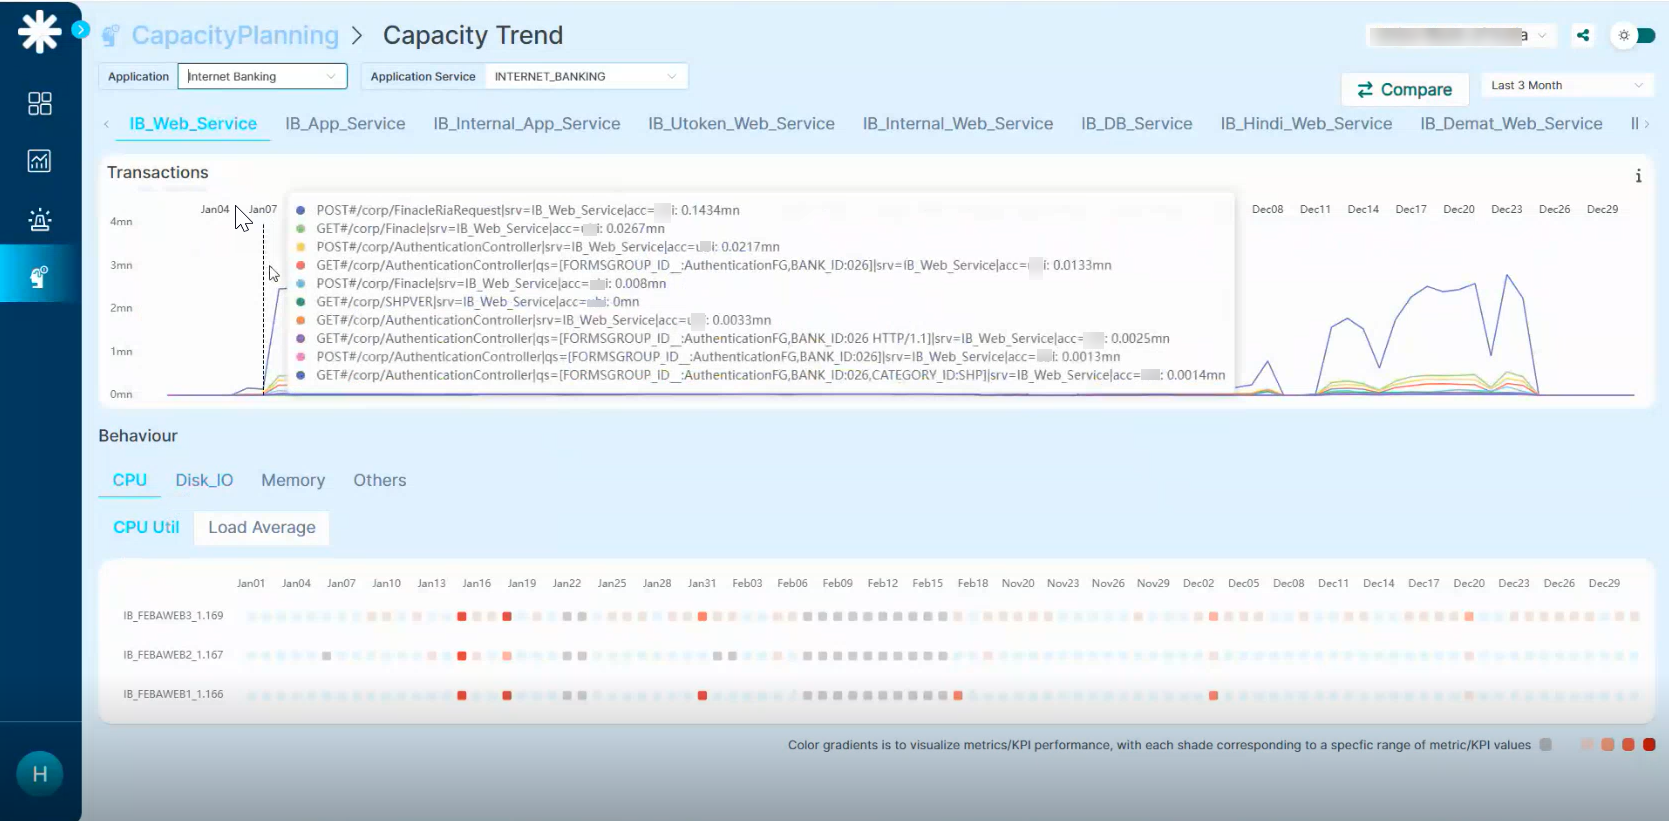
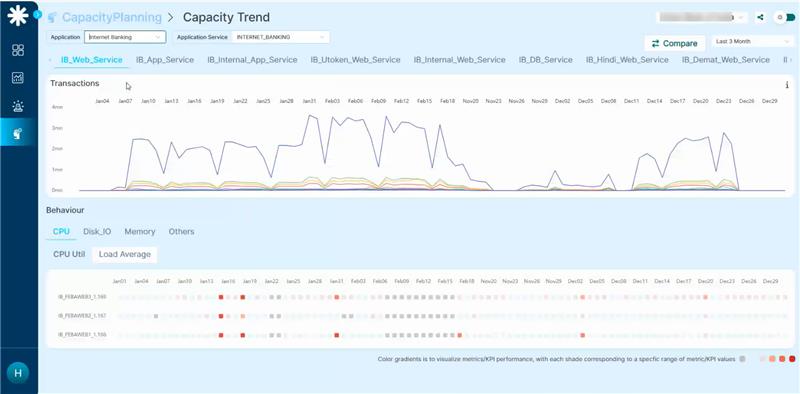
3. View transaction trends and behavior metrics.
- Heap memory usage
- Non-heap memory usage
- CPU utilization
- Disk I/O

Behavior metric
In the Memory section, click Heap Memory Usage to see the behavior KPIs. The graph below shows the events bucketed.
Hover any point on the behavior KPI graph for the details at that timestamp.
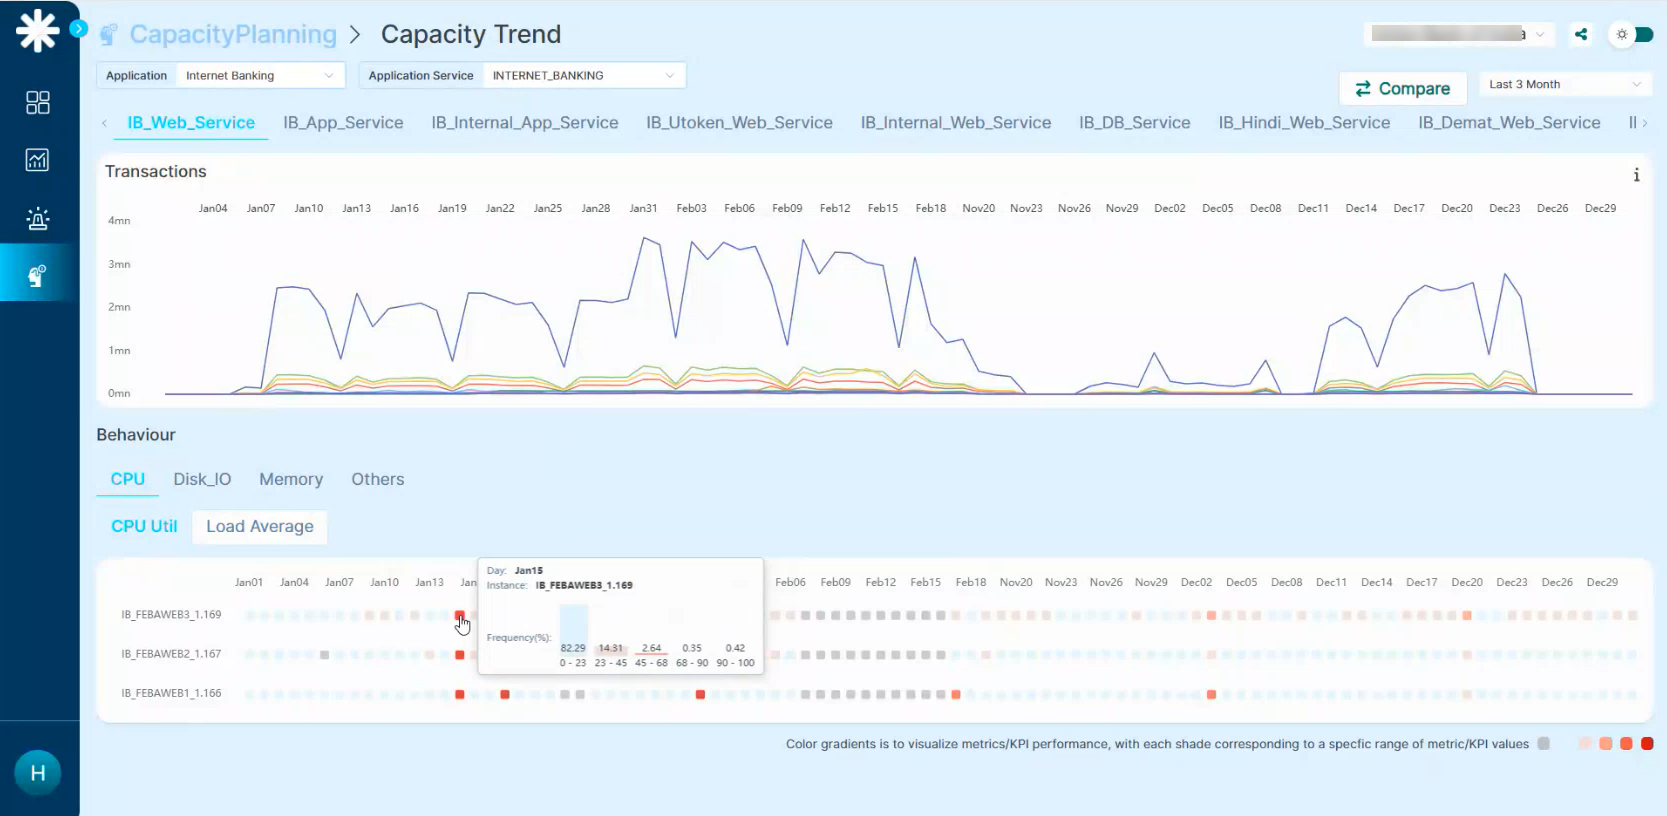
Bucketing and frequency data update based on the instance value.
Generate a Capacity Forecast
Use this when you want full control over the growth assumptions.
1. Open Capacity Forecasting.
2. Click Generate Capacity Forecast for this Workload Mix. Two ways to build the mix:
- For a Week. Lists the top “taxing” transactions for the selected week.
- For a Capacity Metric. Lists the top transactions putting the most stress on the selected capacity KPI.
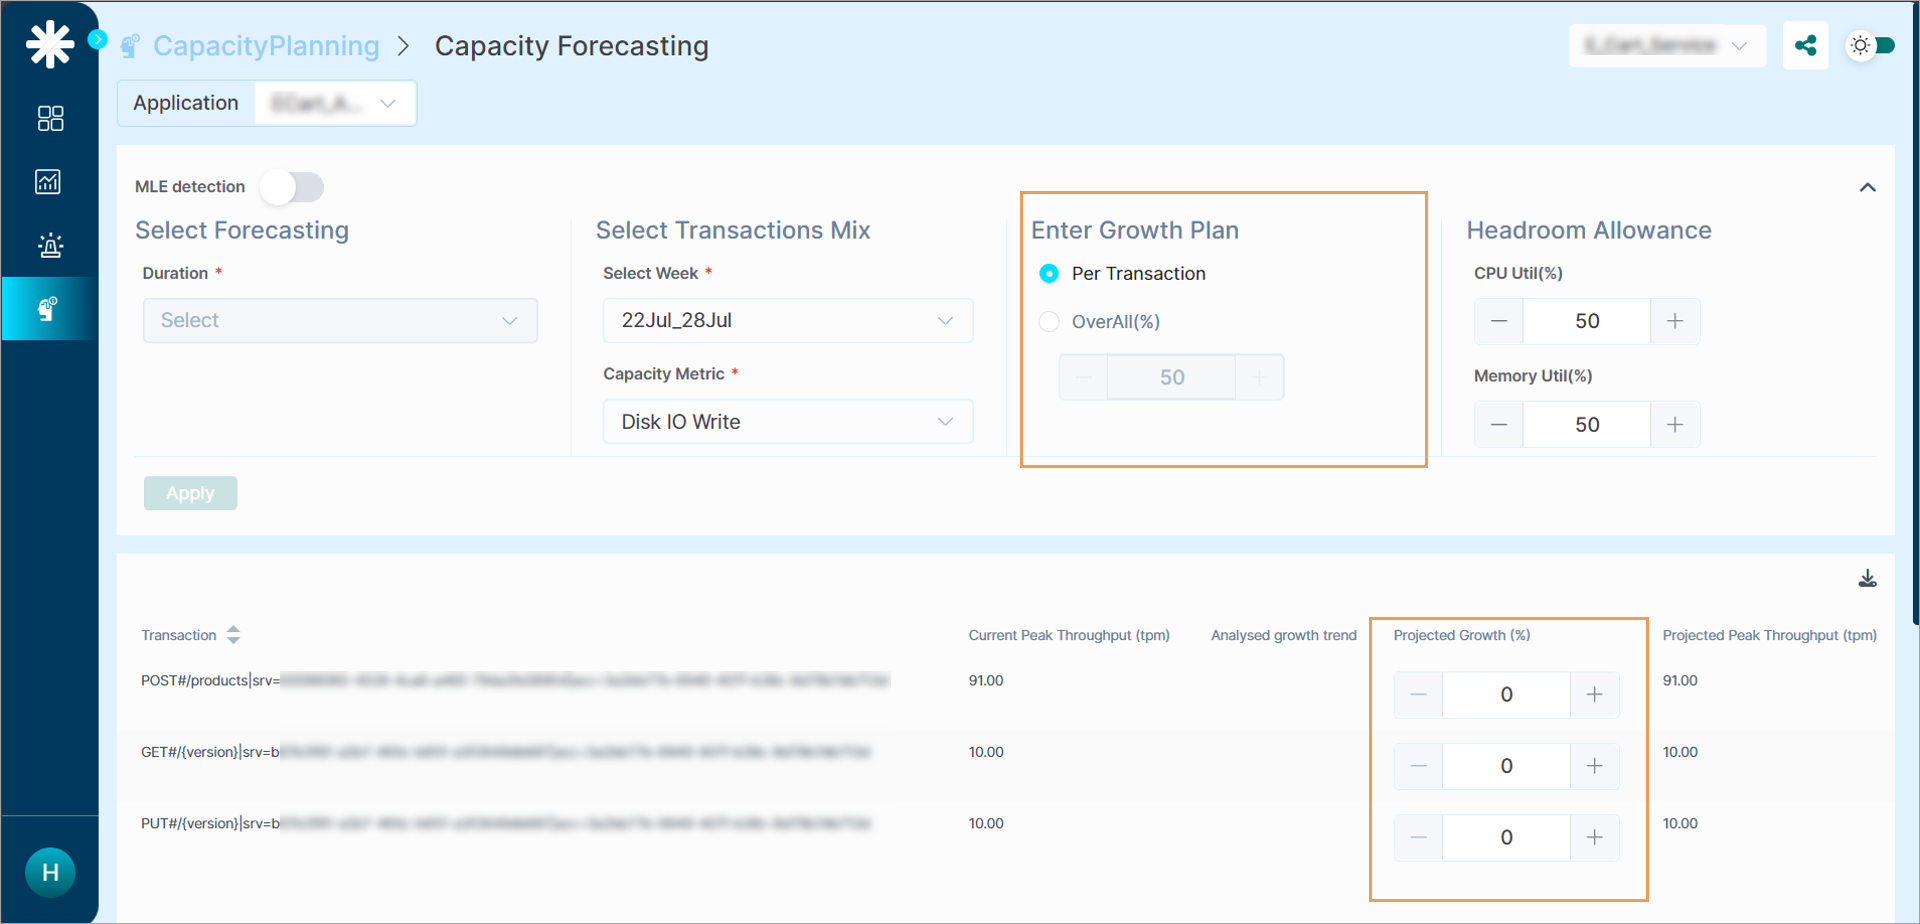
3. Read the workload data.
- A sparkline shows the system-calculated growth trend for each transaction.
- Expected peak throughput is computed from current transaction volume and the projected percentage increase.

4. Pick the Capacity Metric of interest.
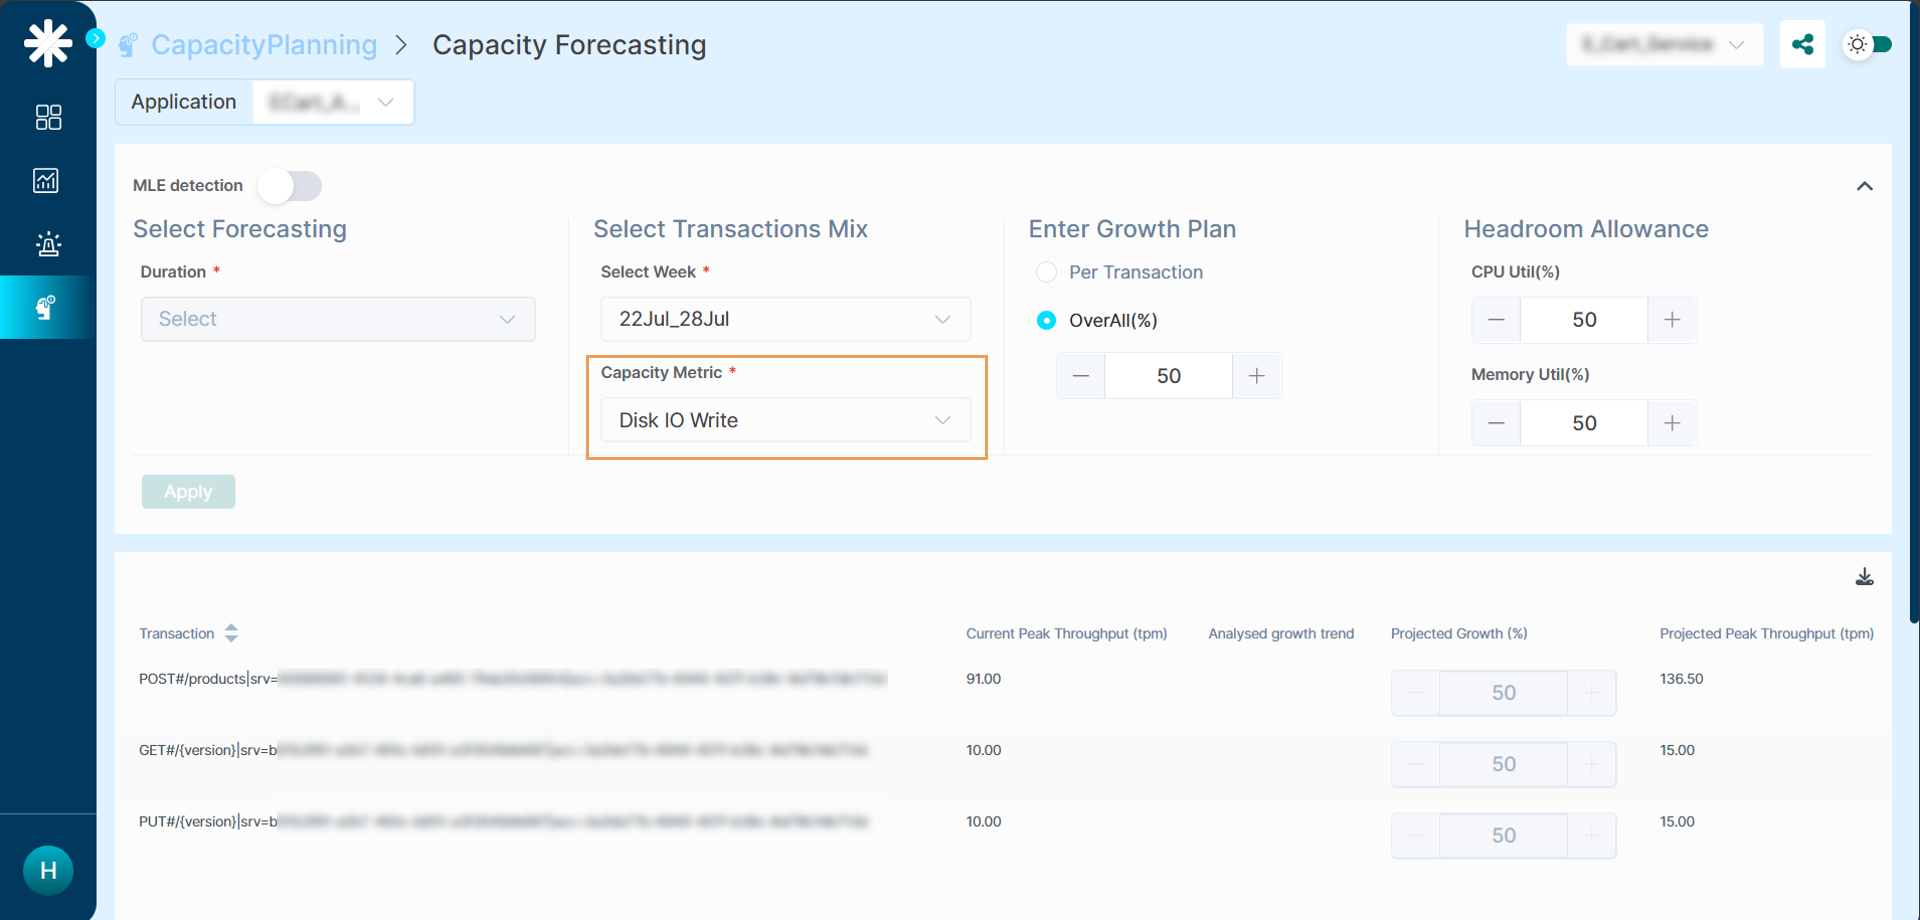
5. Build the growth plan.
- For a specific transaction.
- An overall plan for all transactions.
Type a percentage increase in transaction volume or use the slider to tune the growth percentage.
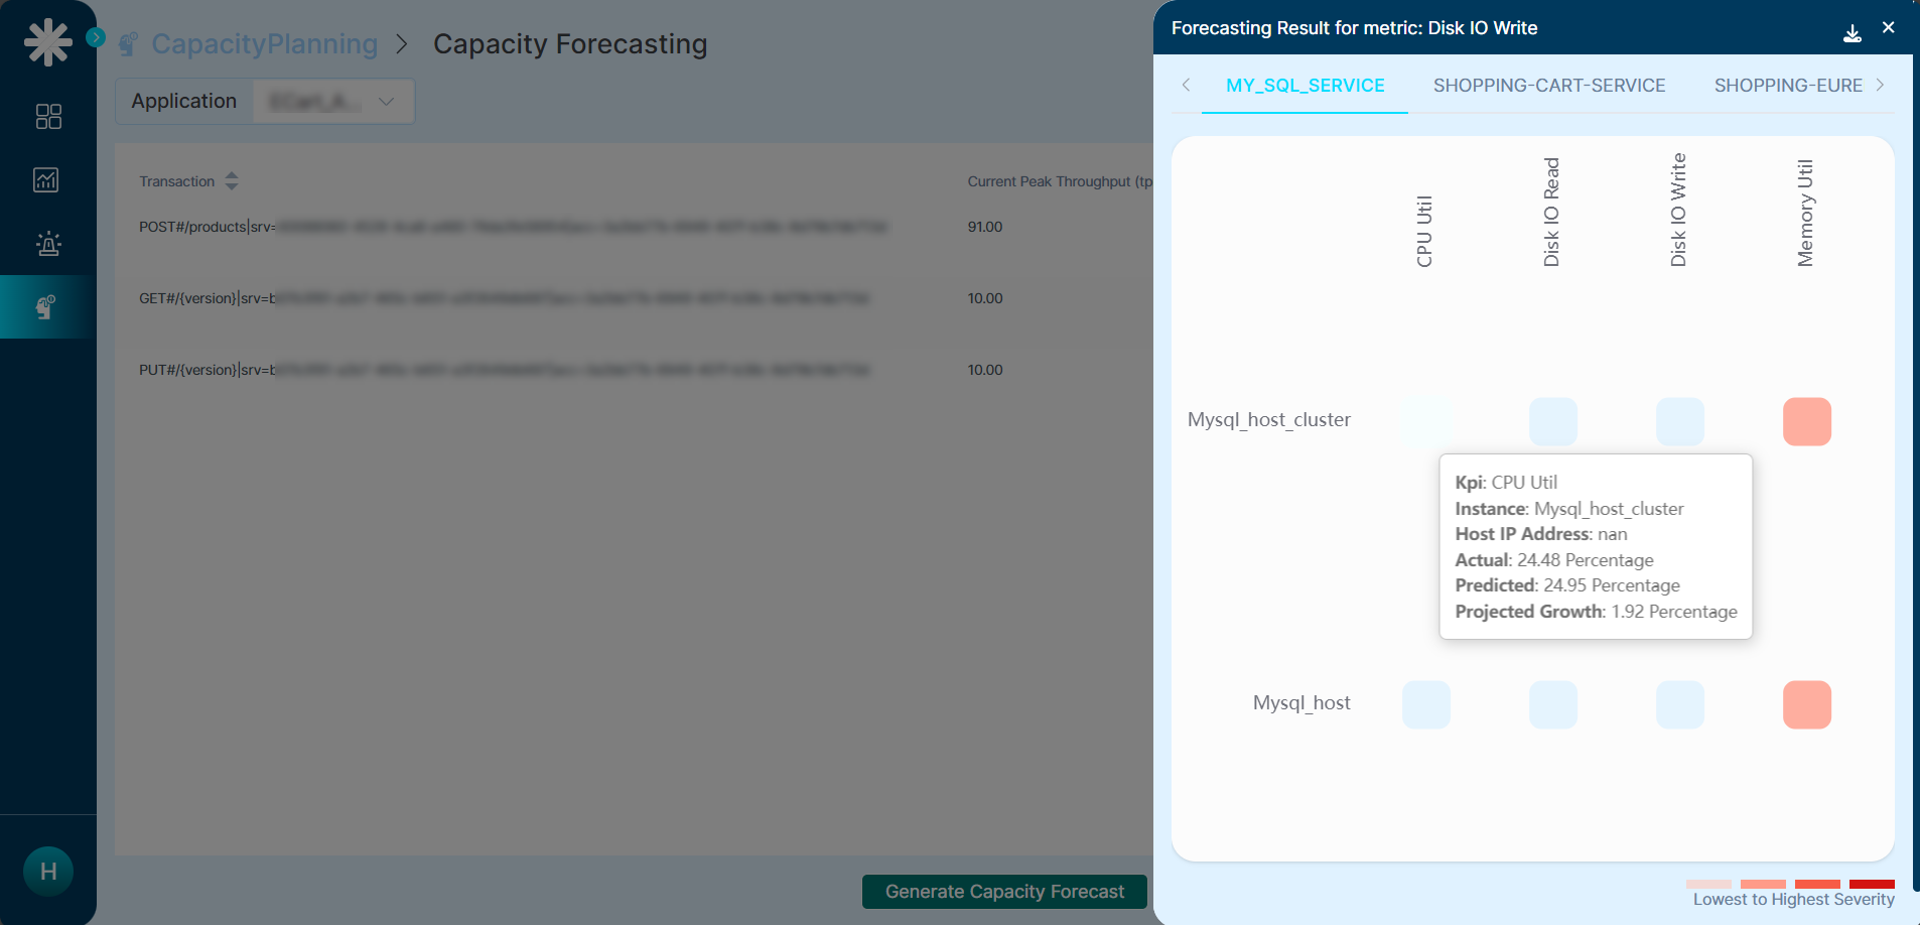
6. Click Generate Capacity Forecast for this Growth Plan. The Capacity Forecast heat map loads at the bottom of the screen.
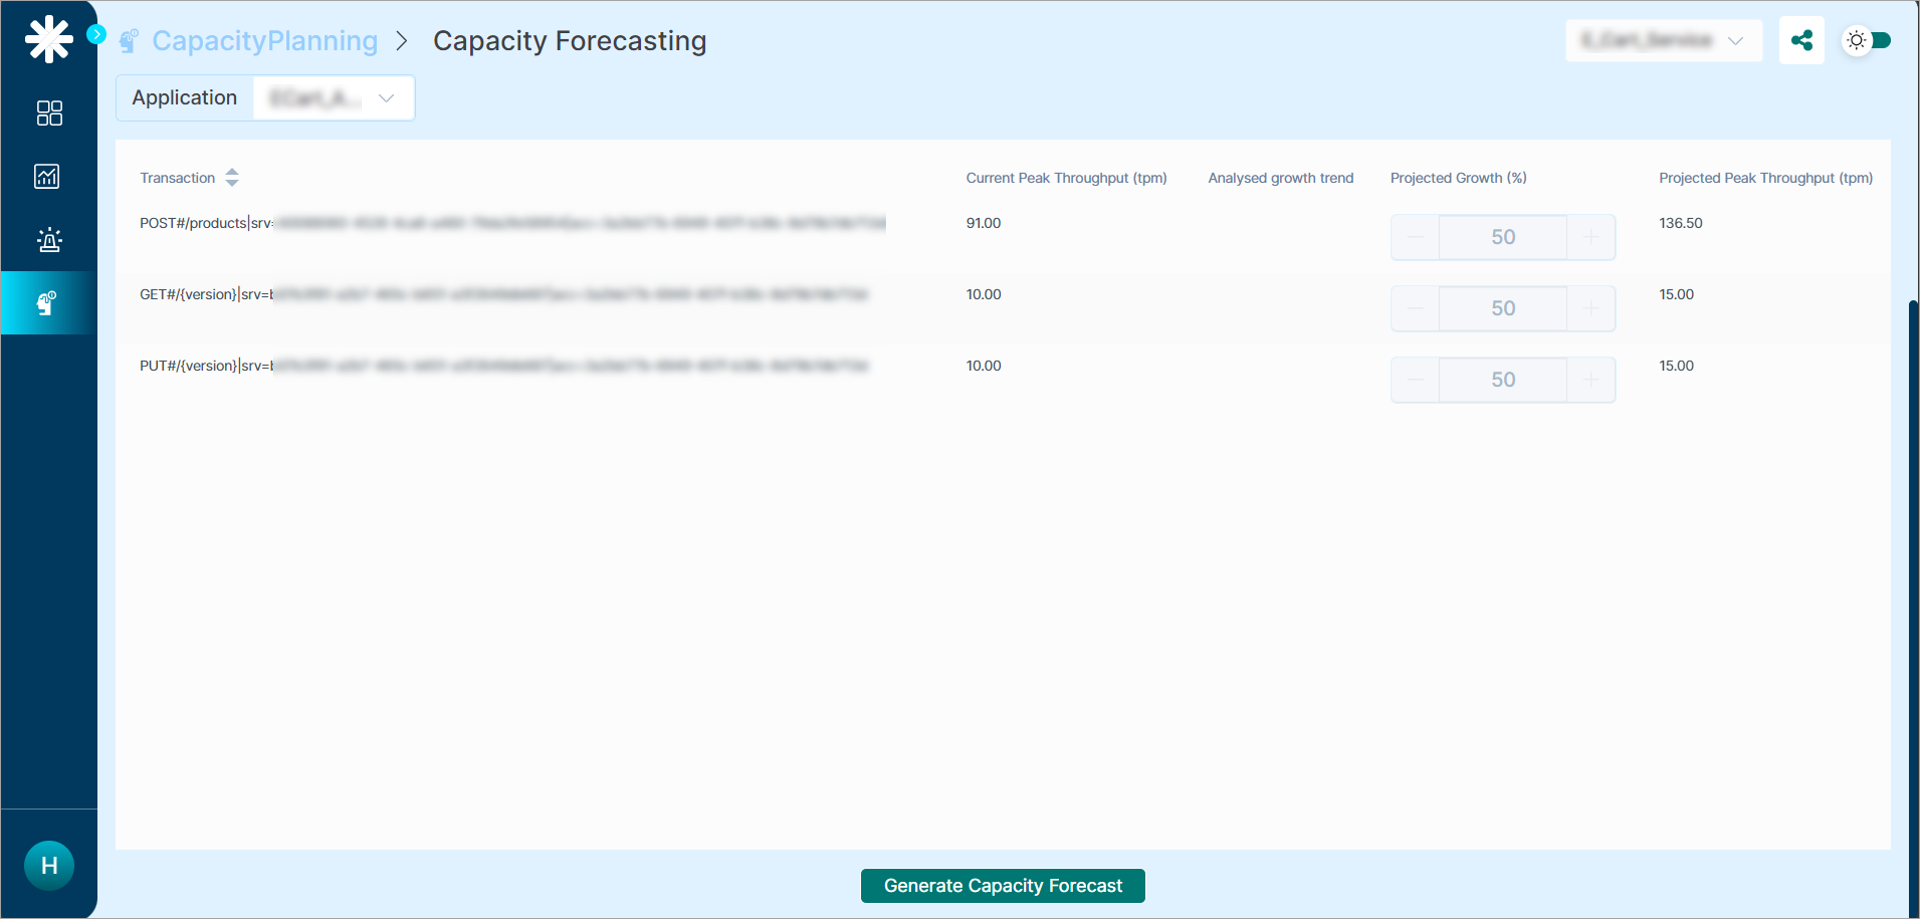
7. Hover any metric in the heat map to see:
- Instance name
- Metric name
- Current value
- Projected value
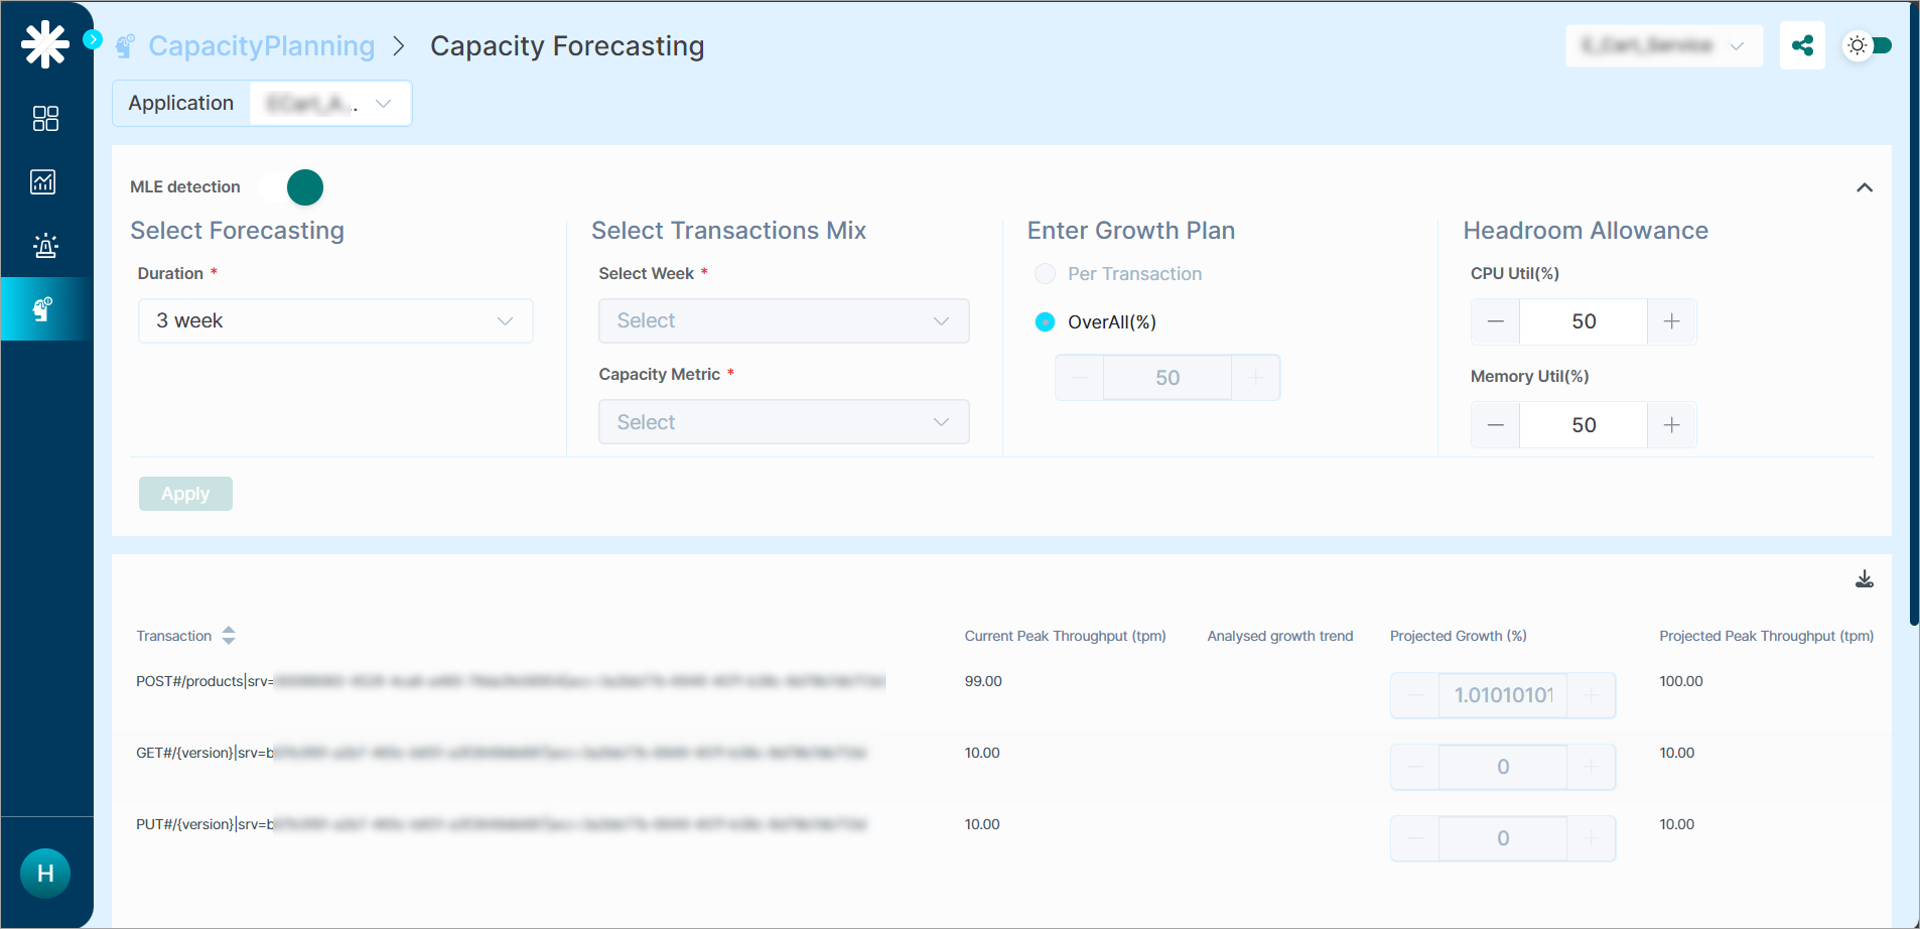
Use the MLE for auto-forecasting
The MLE can compute the growth percentage for you, no manual input needed.
1. Switch on the MLE Detection toggle.
2. Pick a Duration only.
3. Click Apply.
The MLE then:
- Predicts growth for each transaction.
- Estimates future throughput.
- Loads the capacity forecast heat map.
MLE formula.
Next
- Capacity Forecasting Benefits and Features . why this matters.
- Viewing Capacity Heat Map . weekly capacity trend.
- Generating Capacity Forecast . build a forecast on a growth plan.