Search for answers or browse our knowledge base.


Anomaly Detection automatically identifies patterns in operational data that drift from expected behavior. HEAL services, microservices, and components emit huge volumes of logs, metrics, and traces. Manually checking them does not scale.
HEAL’s anomaly detection engine handles real-time streaming data and historical batch analysis, so you can catch issues as they happen and well before they cause an outage.
What it gives you
- Continuously sets baselines.
- Generates an anomaly automatically when a real-time breach occurs.
- Reduces noise and false detections.
- Sends an alert before the outage.
View anomalies
Open an incident page in the HEAL UI.
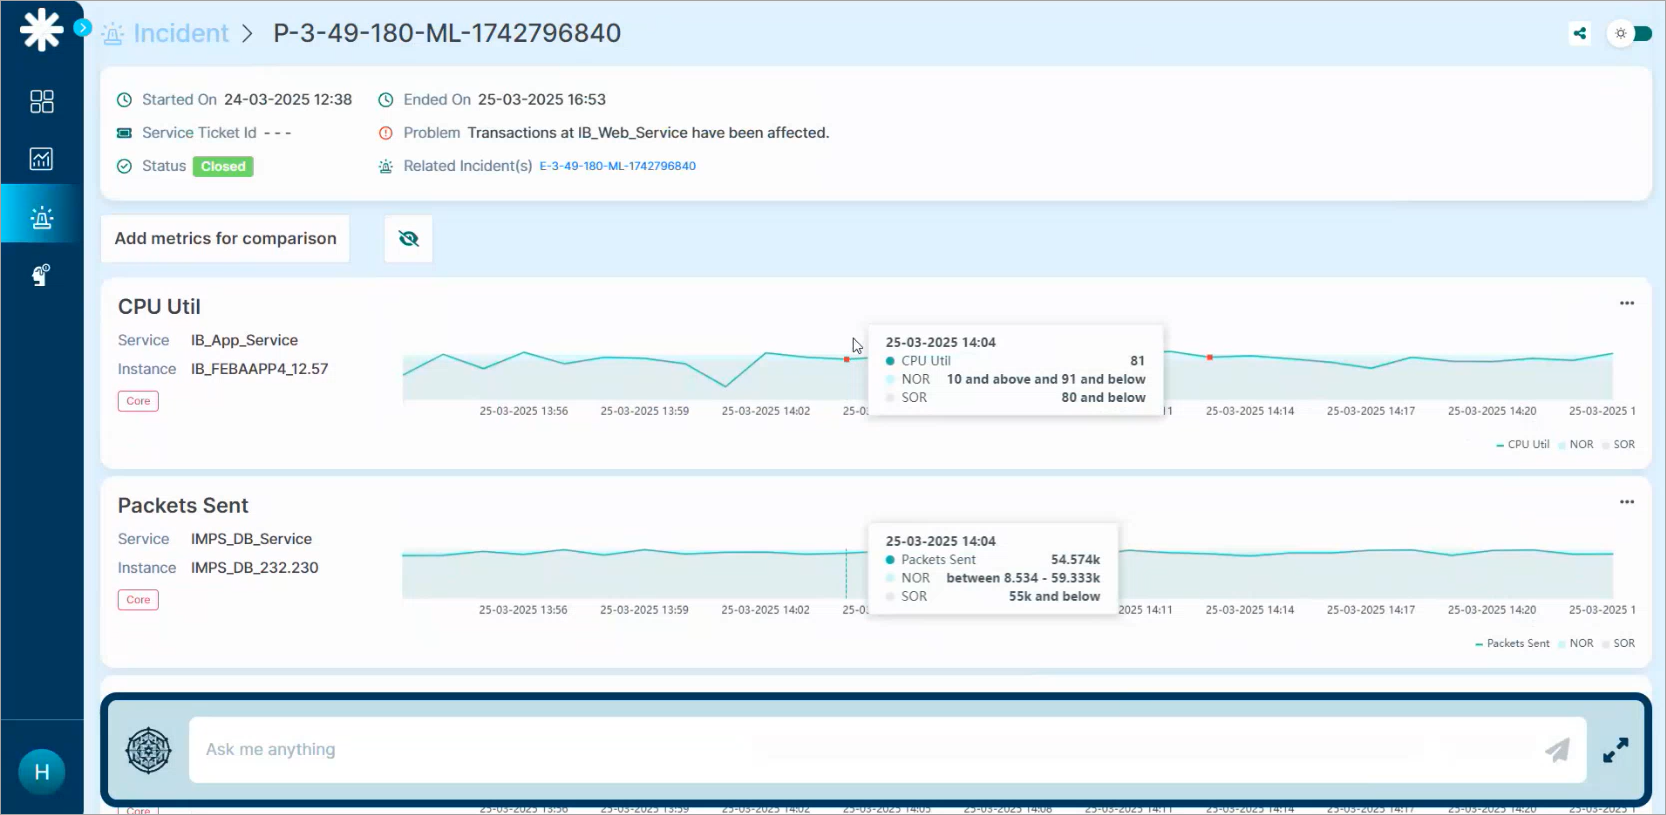
1. Scroll down to the metrics section to see the graphs of impacted metrics. For example, CPU Util or Packets Sent.
2. Look for red dots. They mark anomalies the AD engine detected.
3. Hover any red dot to see the anomaly’s context.
- NOR (Normal Operating Range)
- SOR (Safe Operating Range)
4. Click the red dot. The Event Details popup opens with forensic details.

Next
- Event Correlation . the event-level graph for an incident.
- Root Cause Analysis . automated RCA in HEAL.
- Incident Details . open one incident.