Search for answers or browse our knowledge base.


HEAL Health KPIs measure every component of the HEAL platform itself. Use them to keep the application running healthy and to spot issues with HEAL services, agents, and databases.
Open the HEAL Health dashboard
1. Log in to the HEAL UI. See Accessing HEAL UI.
2. Pick the account, then go to Services > Applications.
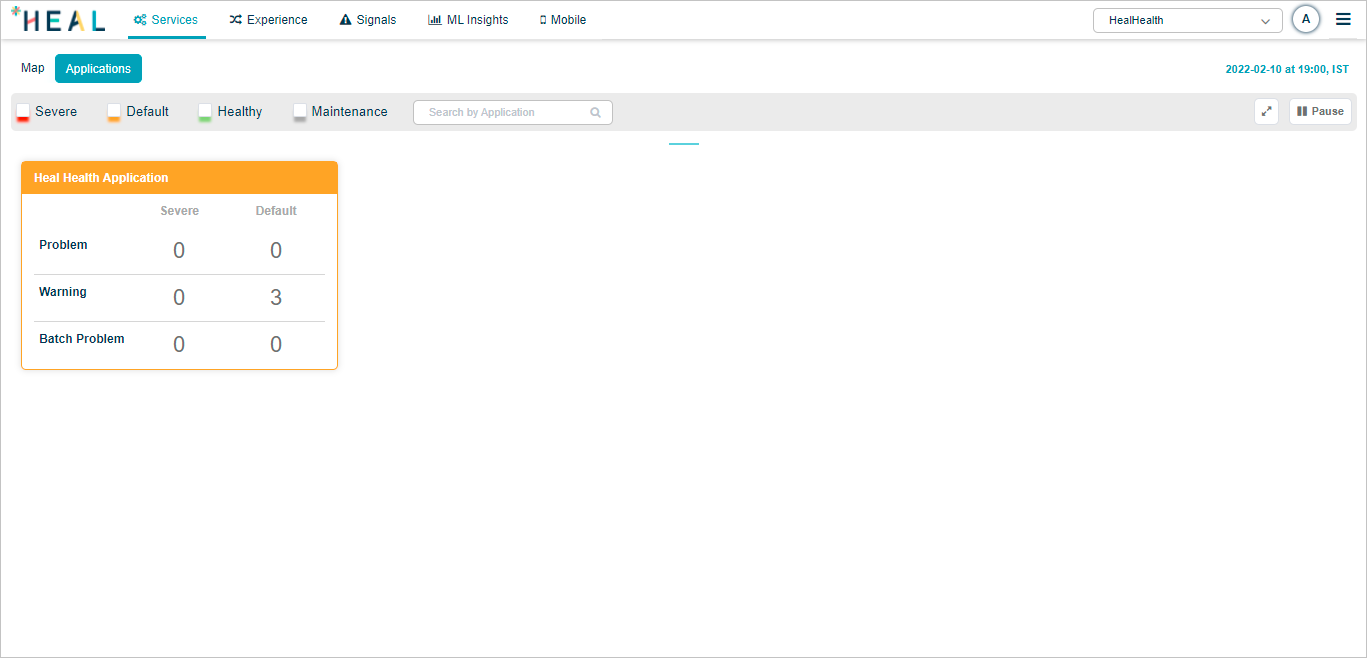
Click the application pod to open the Service Dependency Map (SDM) for HEAL services.
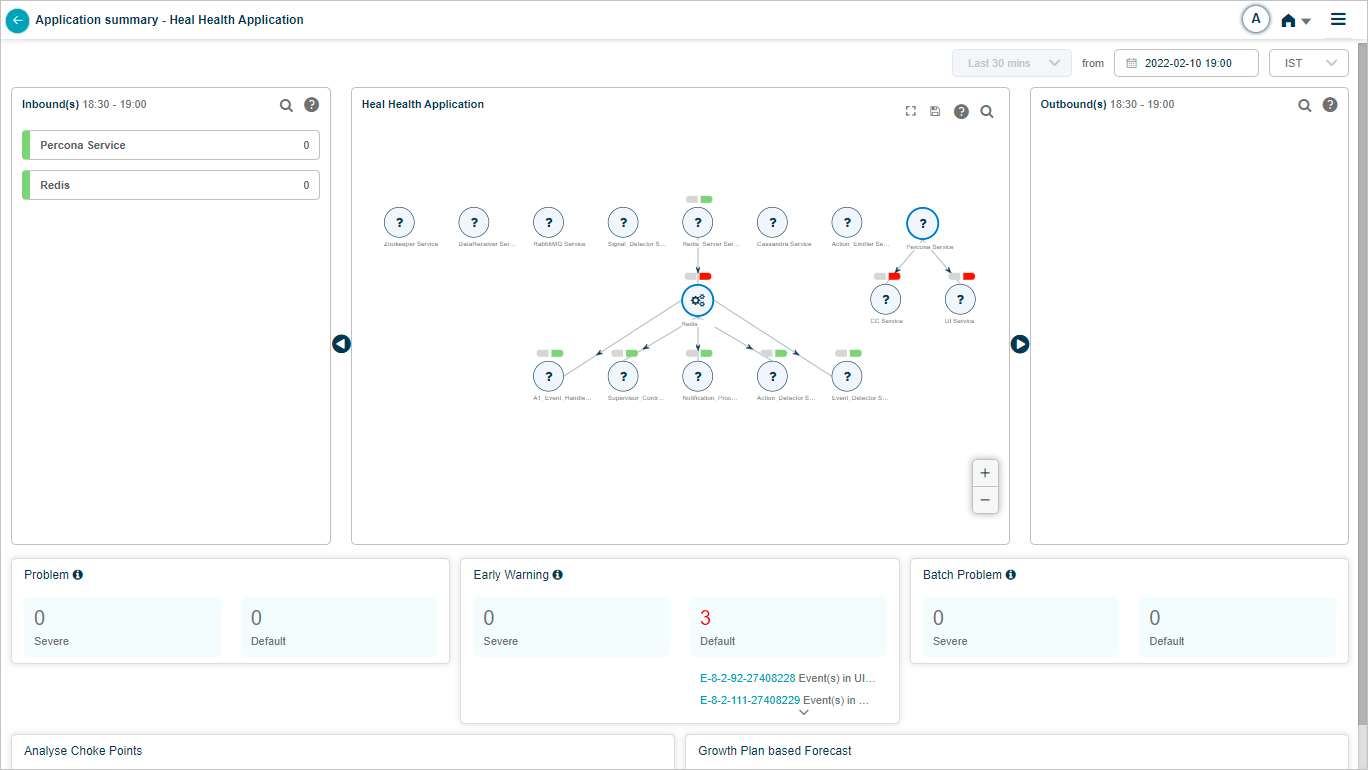
For the selected duration, you see:
- Inbound data
- SDM with current condition
- Outbound data
- Problems
- Early warnings
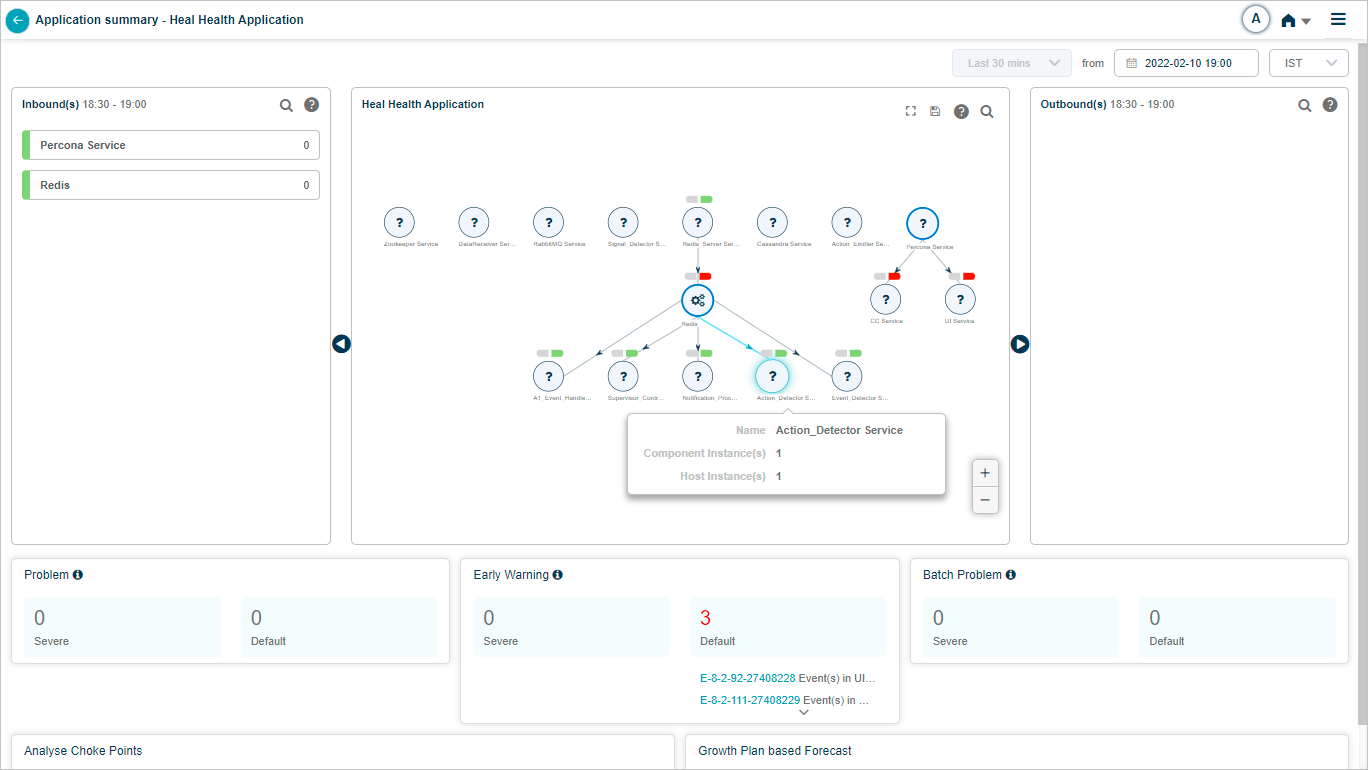
Click any HEAL service to see its summary.
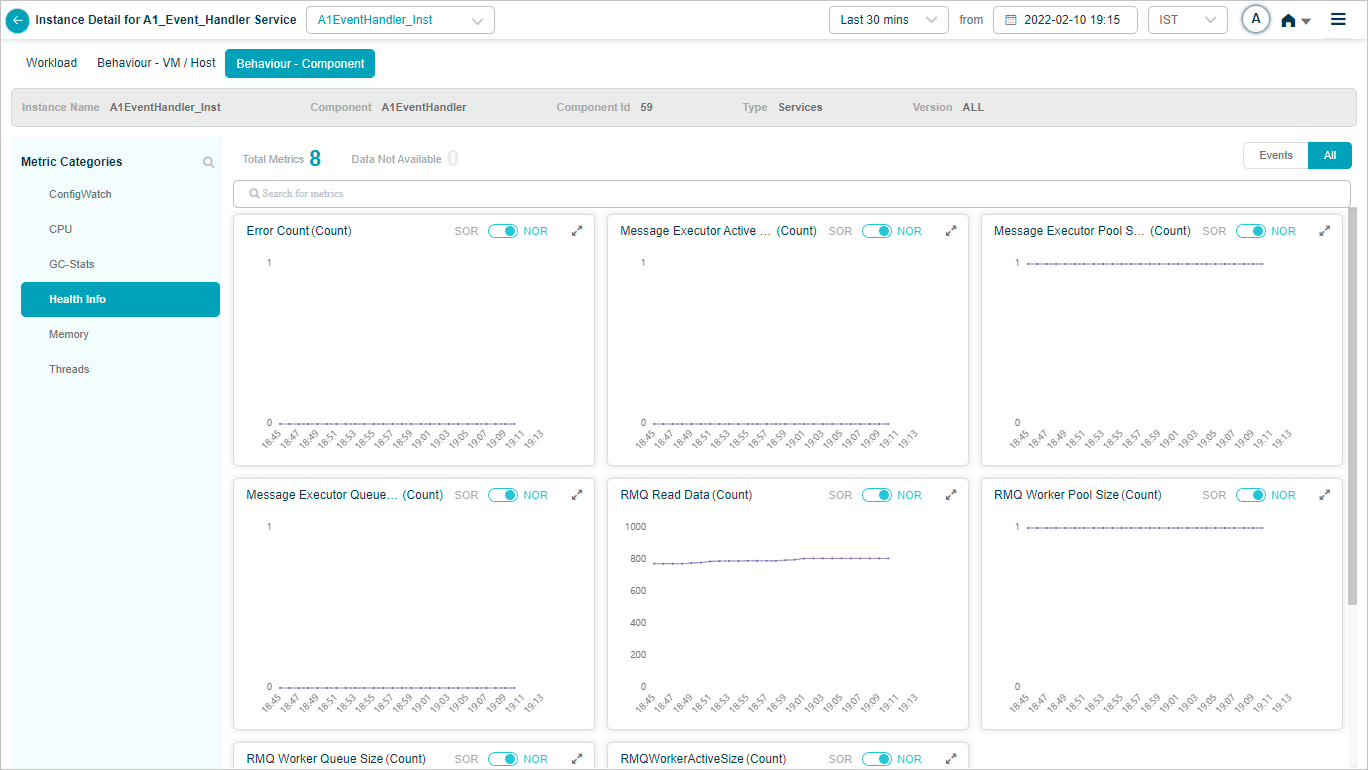
Event Handler
Behavior of the Event Handler service hosts and components.
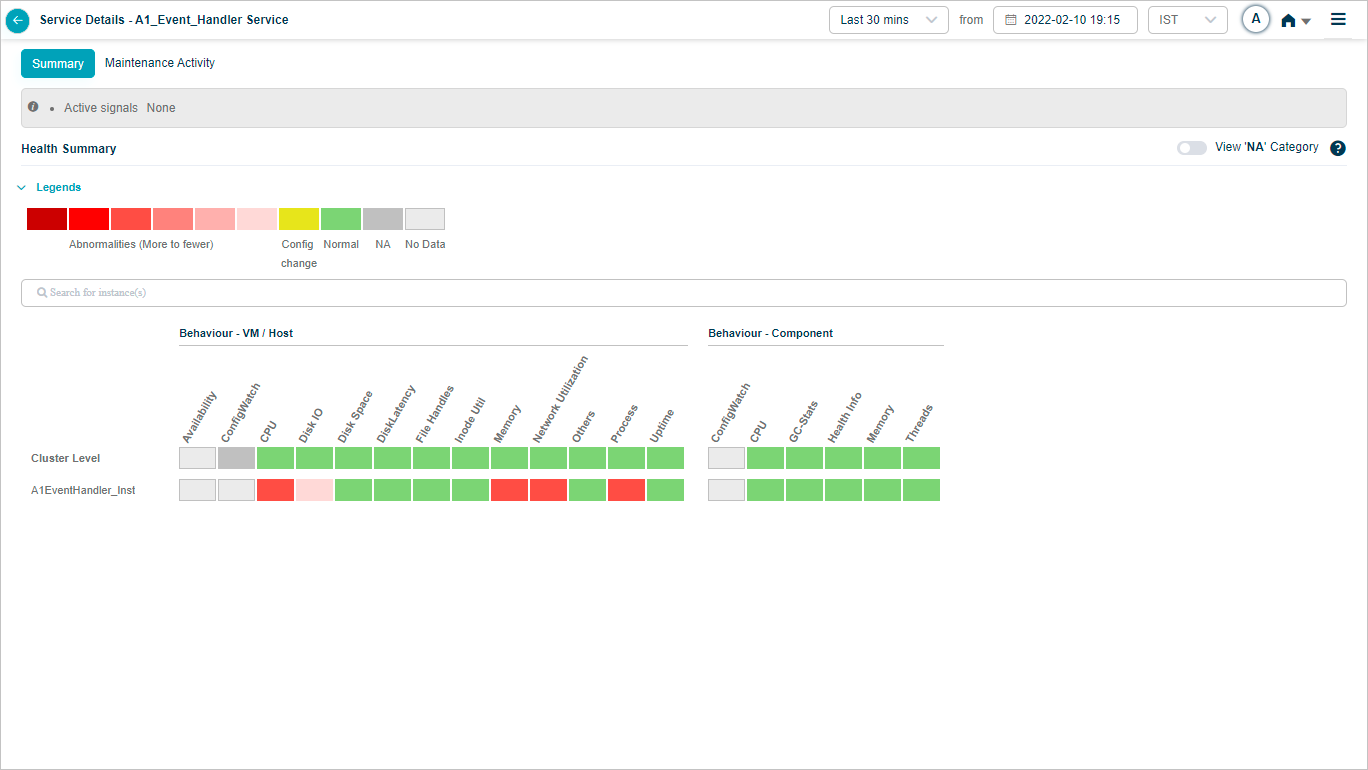
Click any KPI to see its graph.
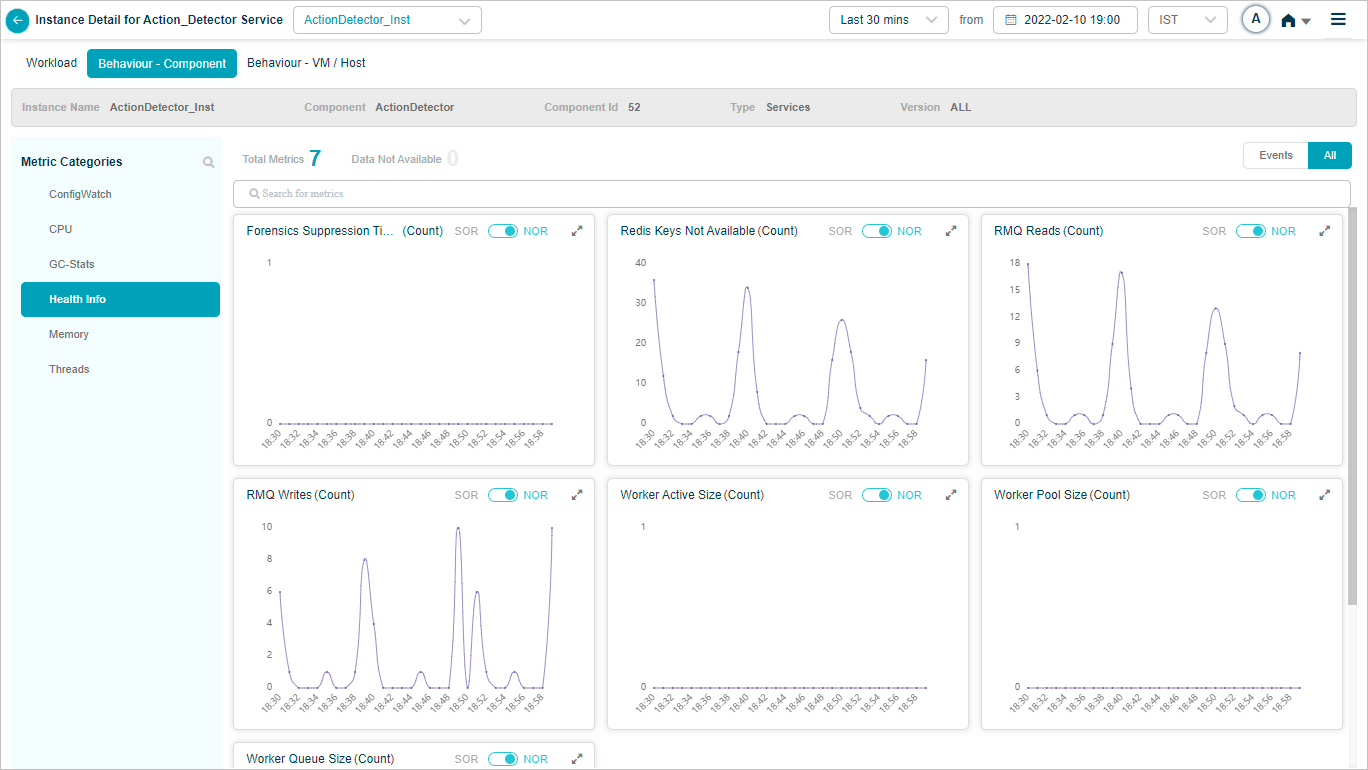
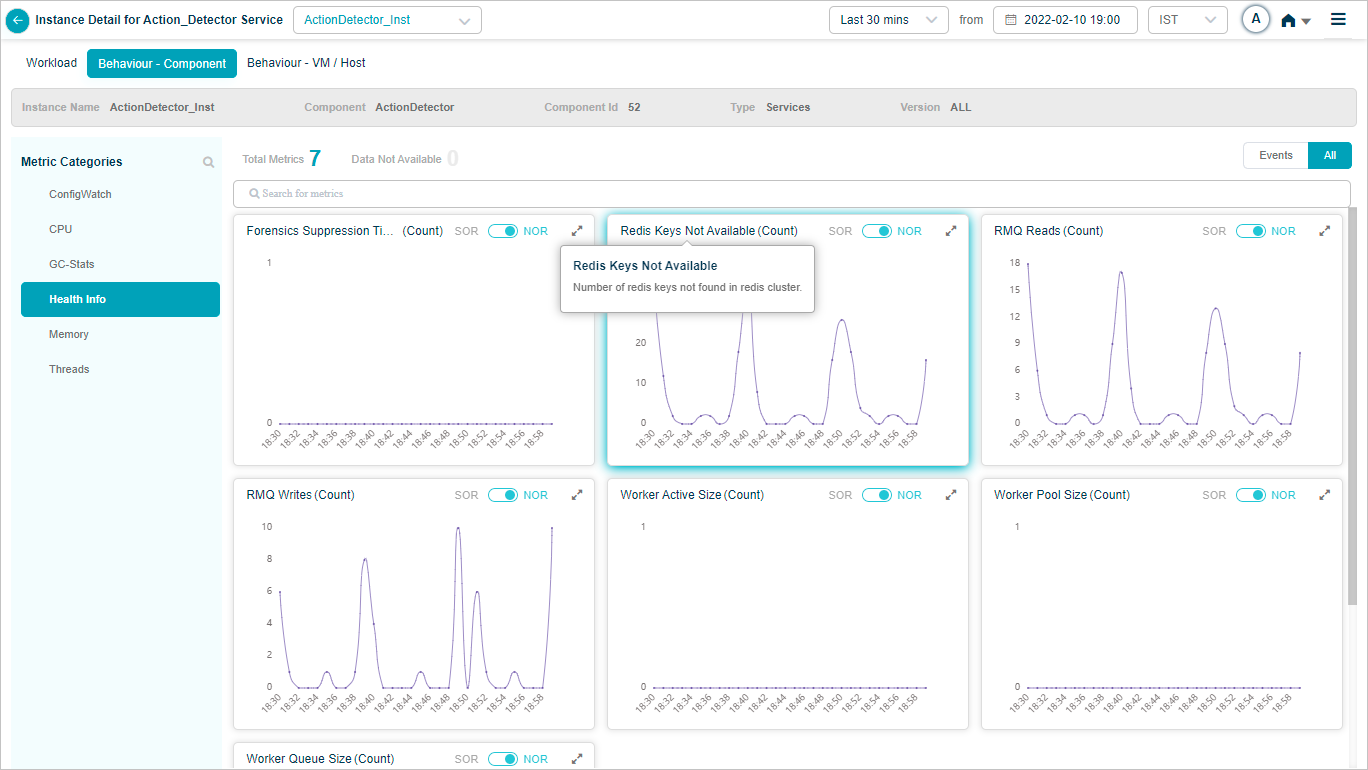
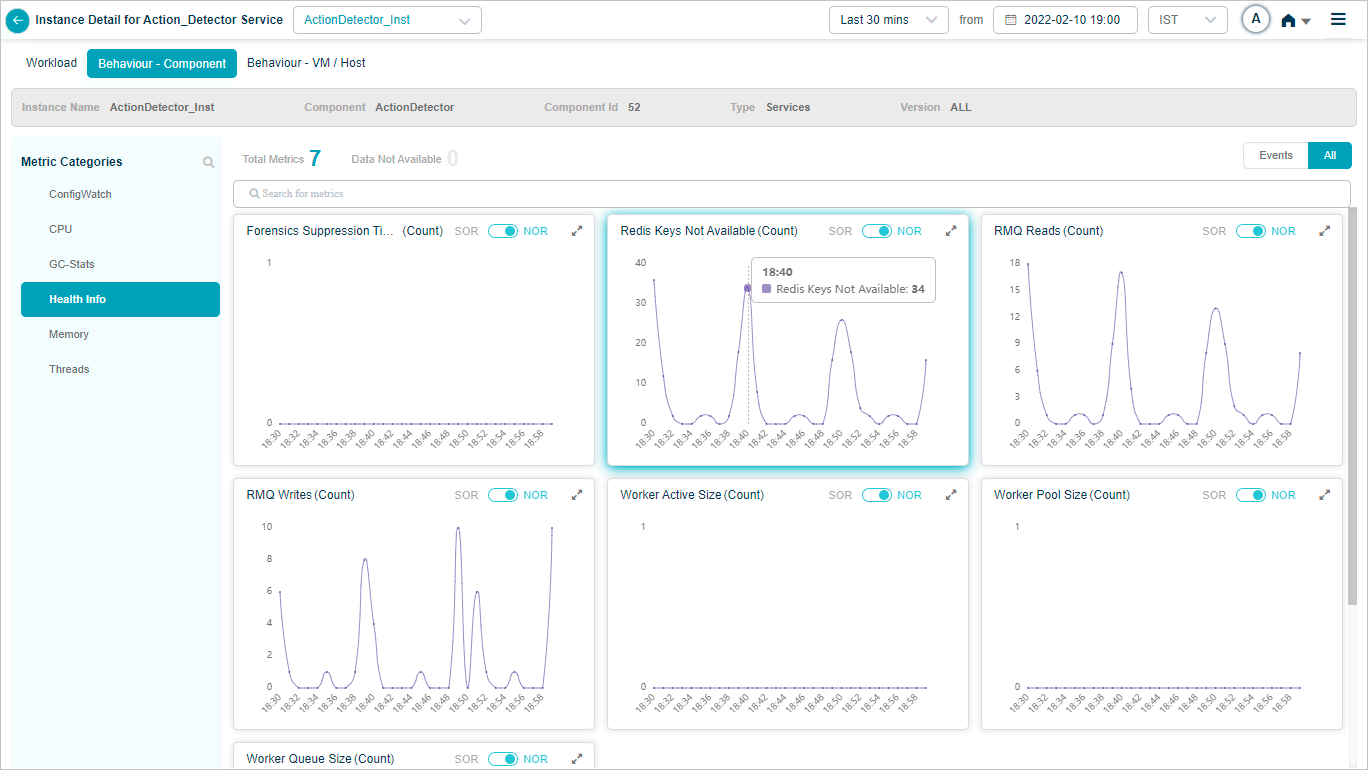
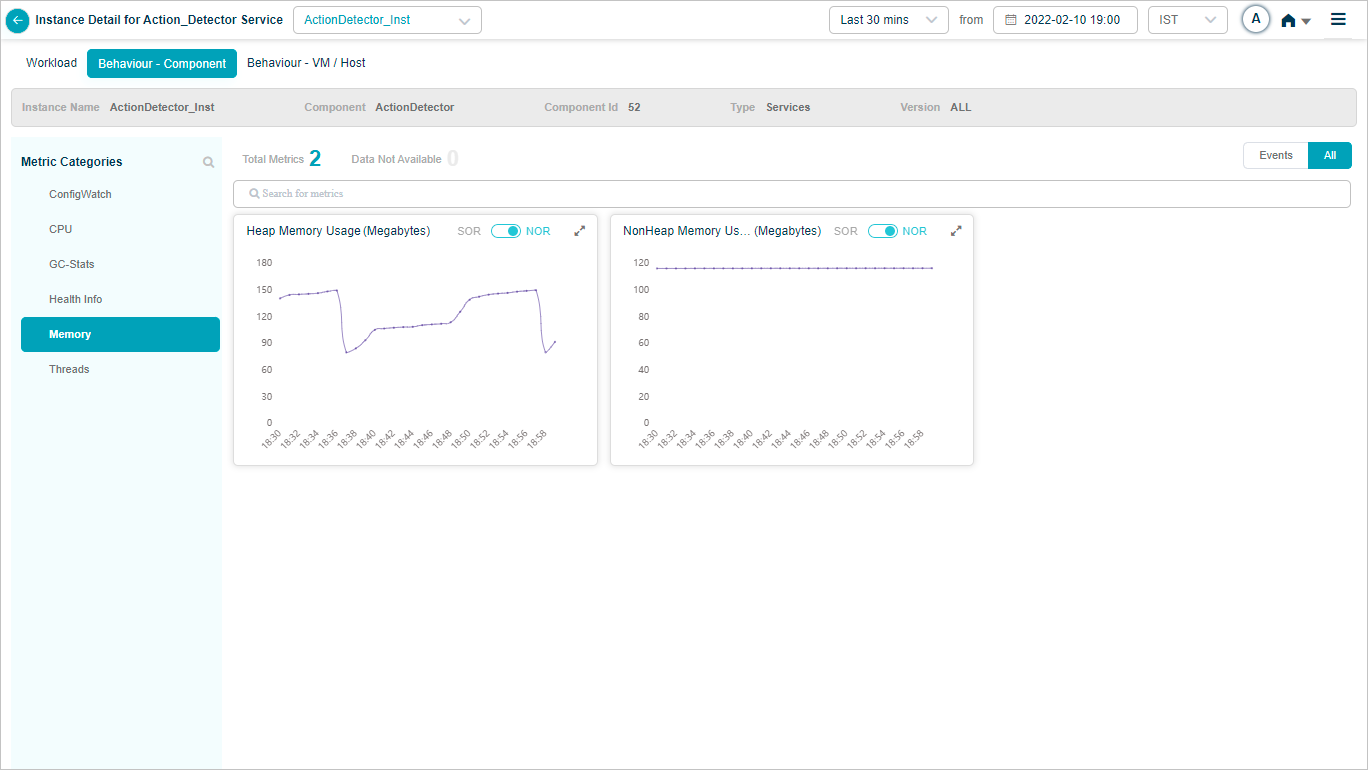
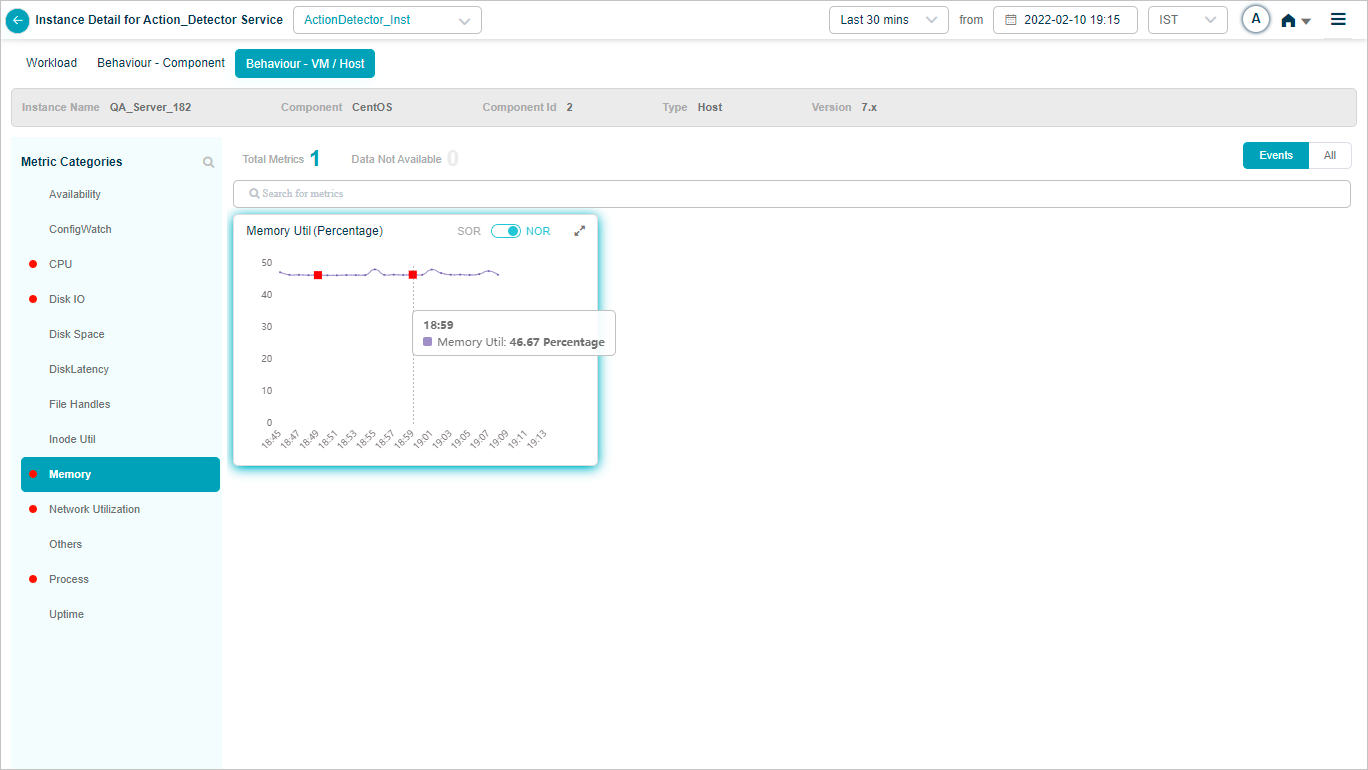
Action Detector
Behavior of the Action Detector service hosts and components.

Click any KPI to see its graph.
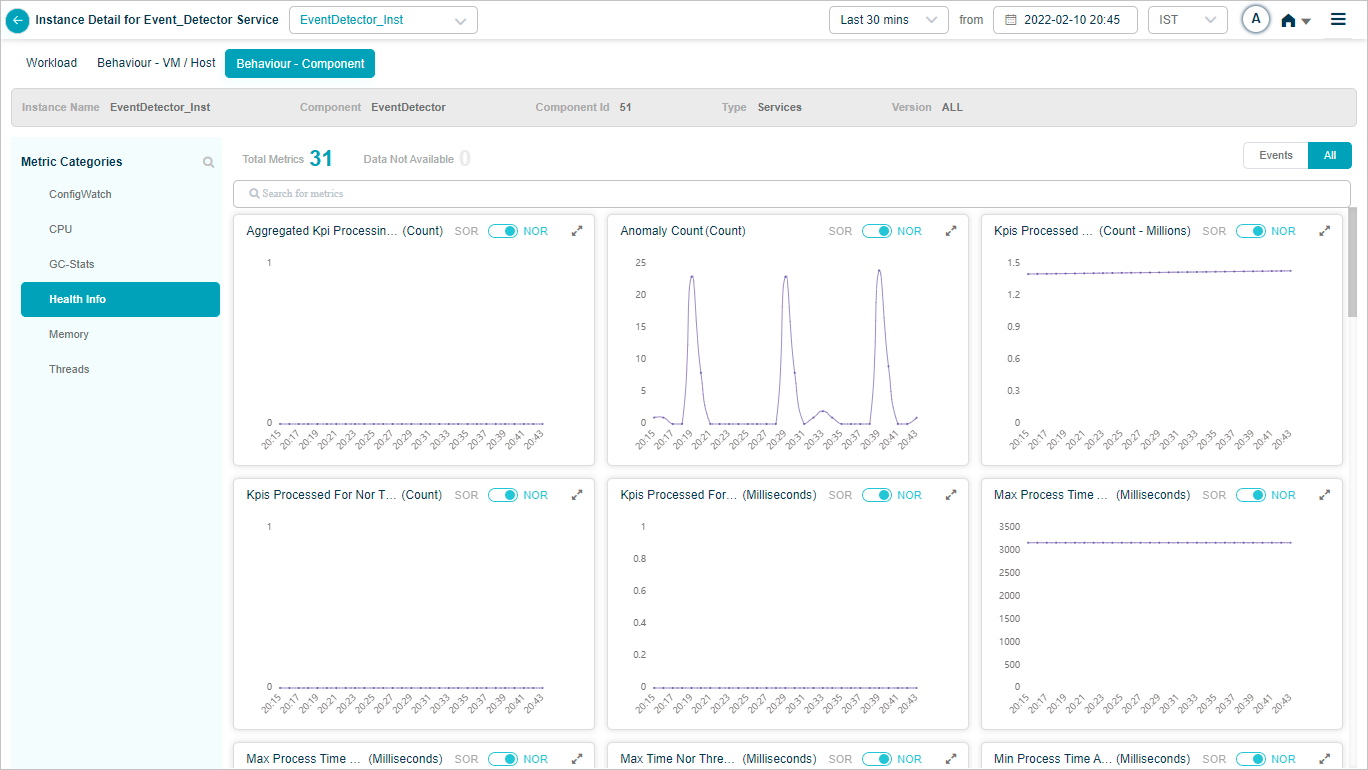
Event Detector
Behavior of the Event Detector service hosts and components.

Click any KPI to see its graph.


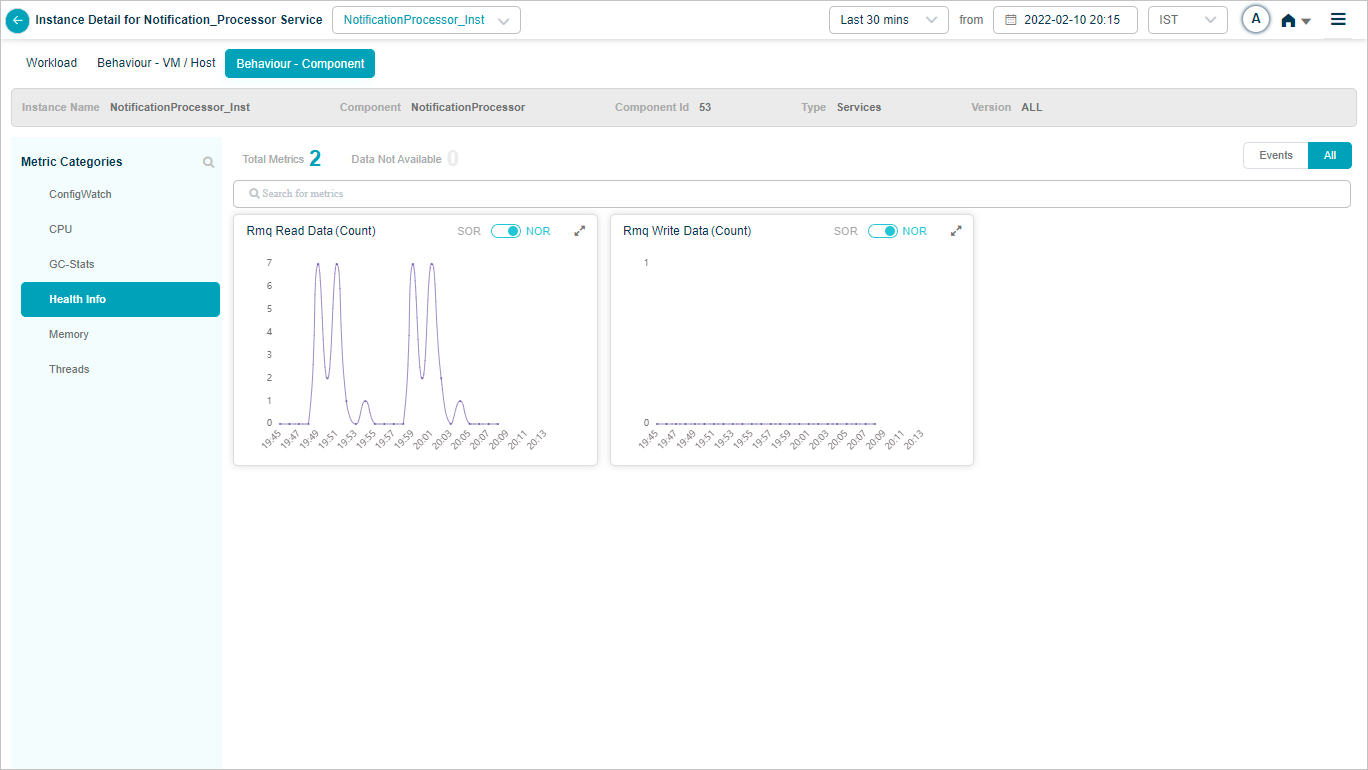
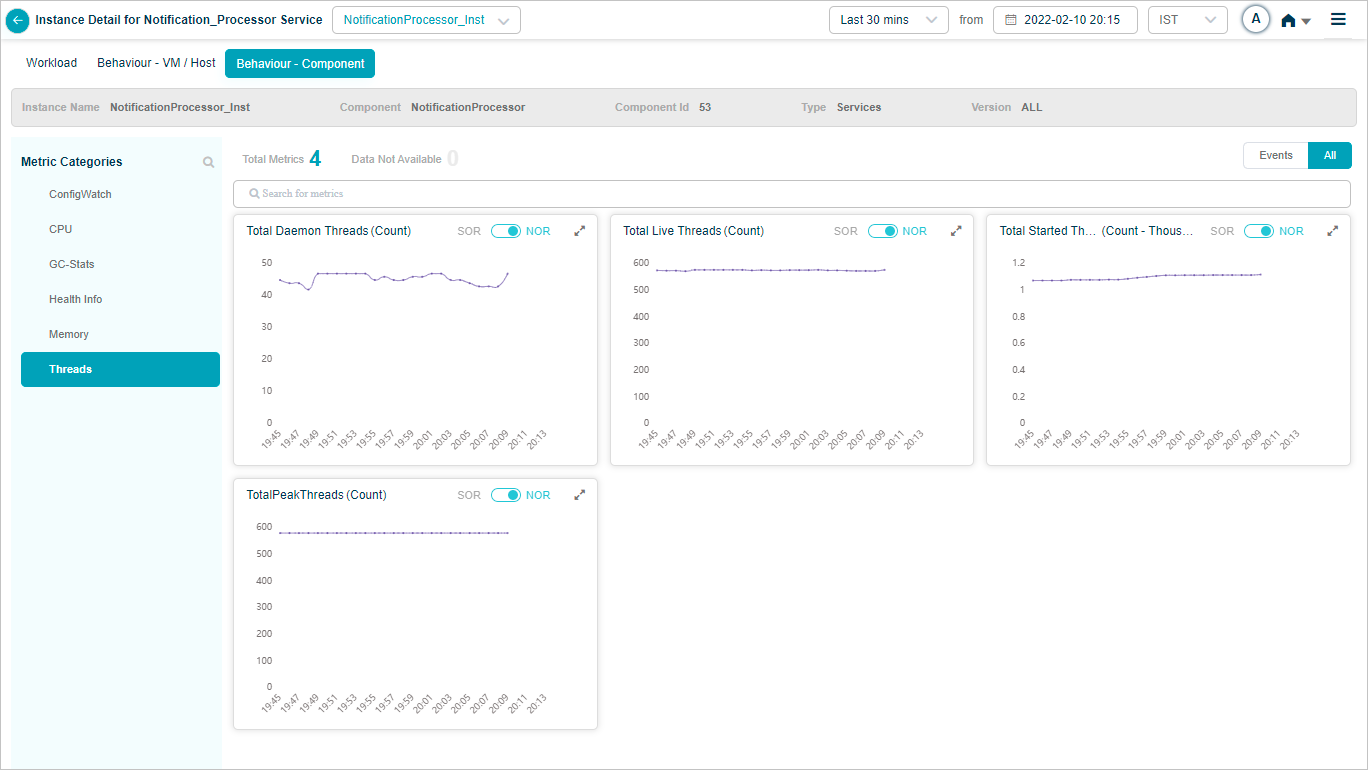
Notification Processor
Behavior of the Notification Processor service hosts and components.
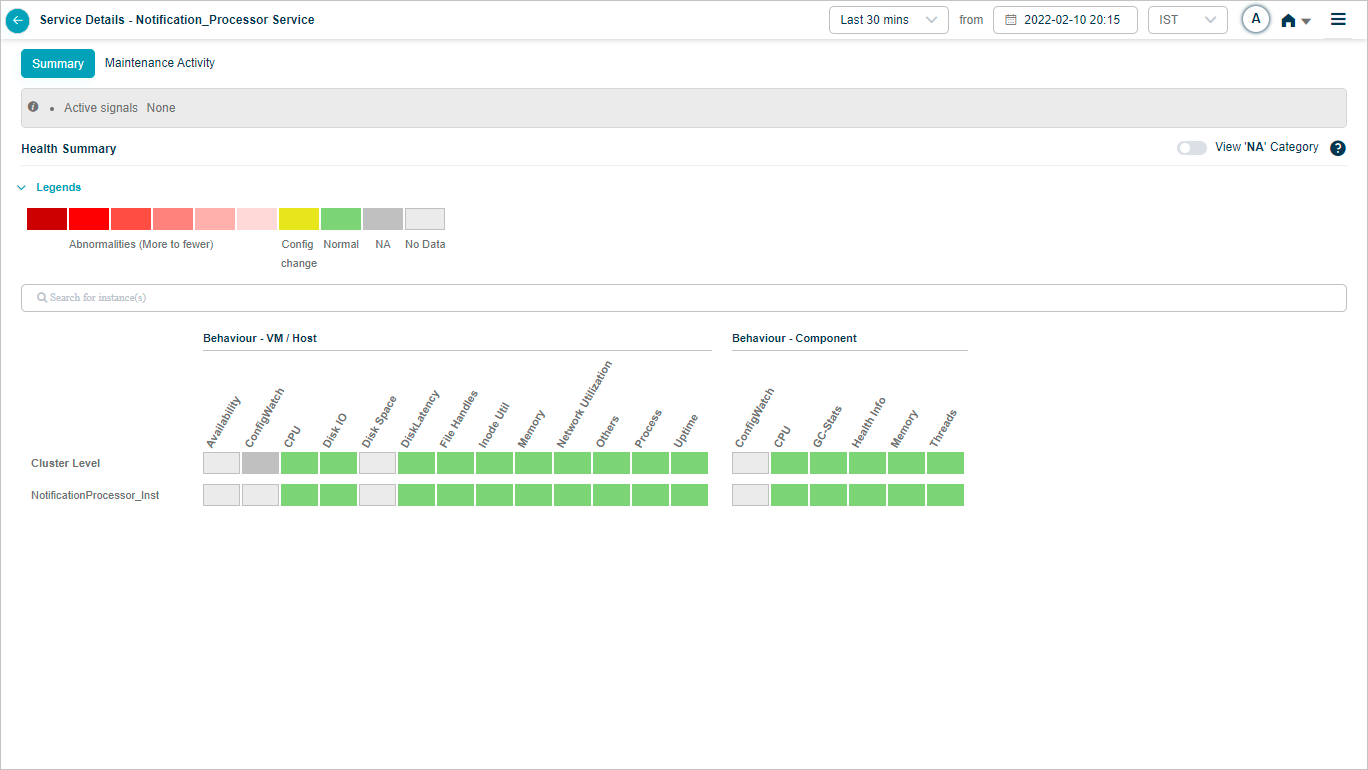
Click any KPI to see its graph.
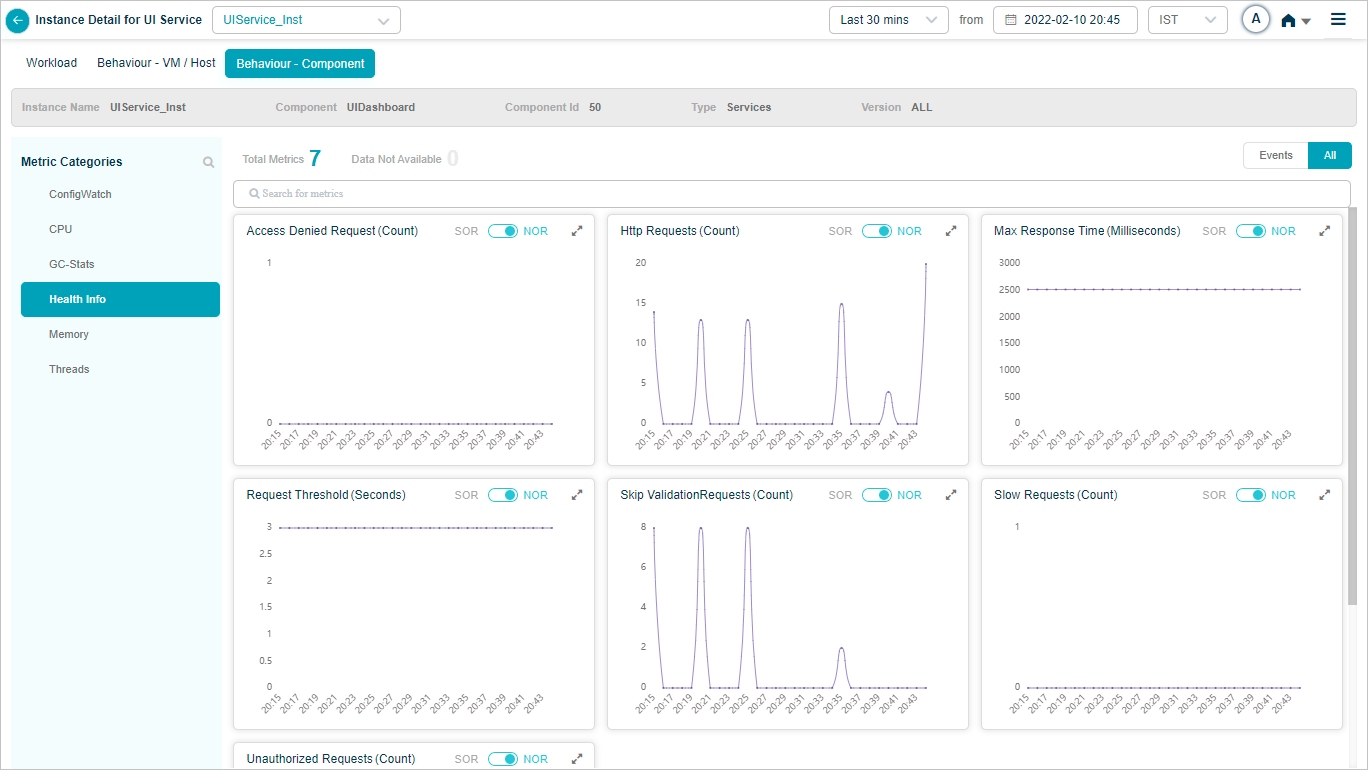
HEAL UI Service
Behavior of the HEAL UI service hosts and components.

Click any KPI to see its graph.

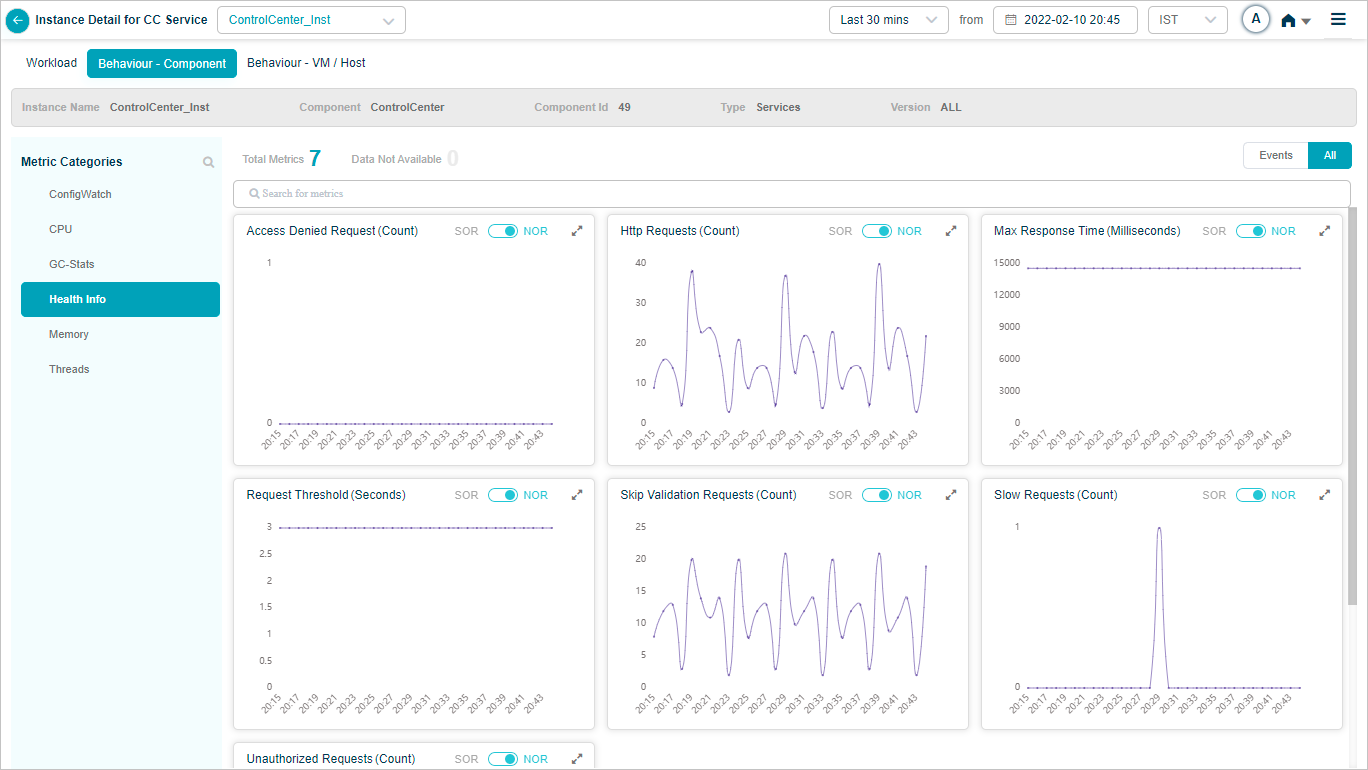
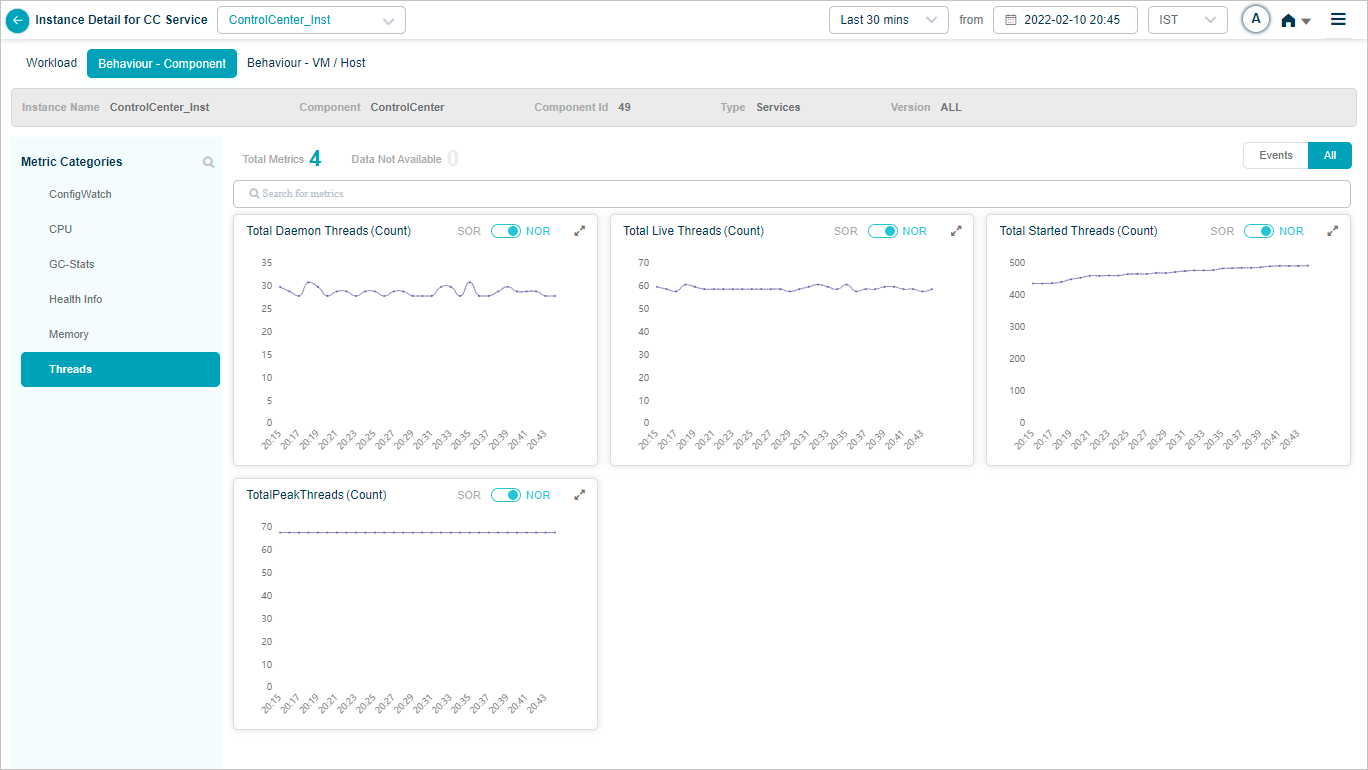
Control Center Service
Behavior of the Control Center service hosts and components.
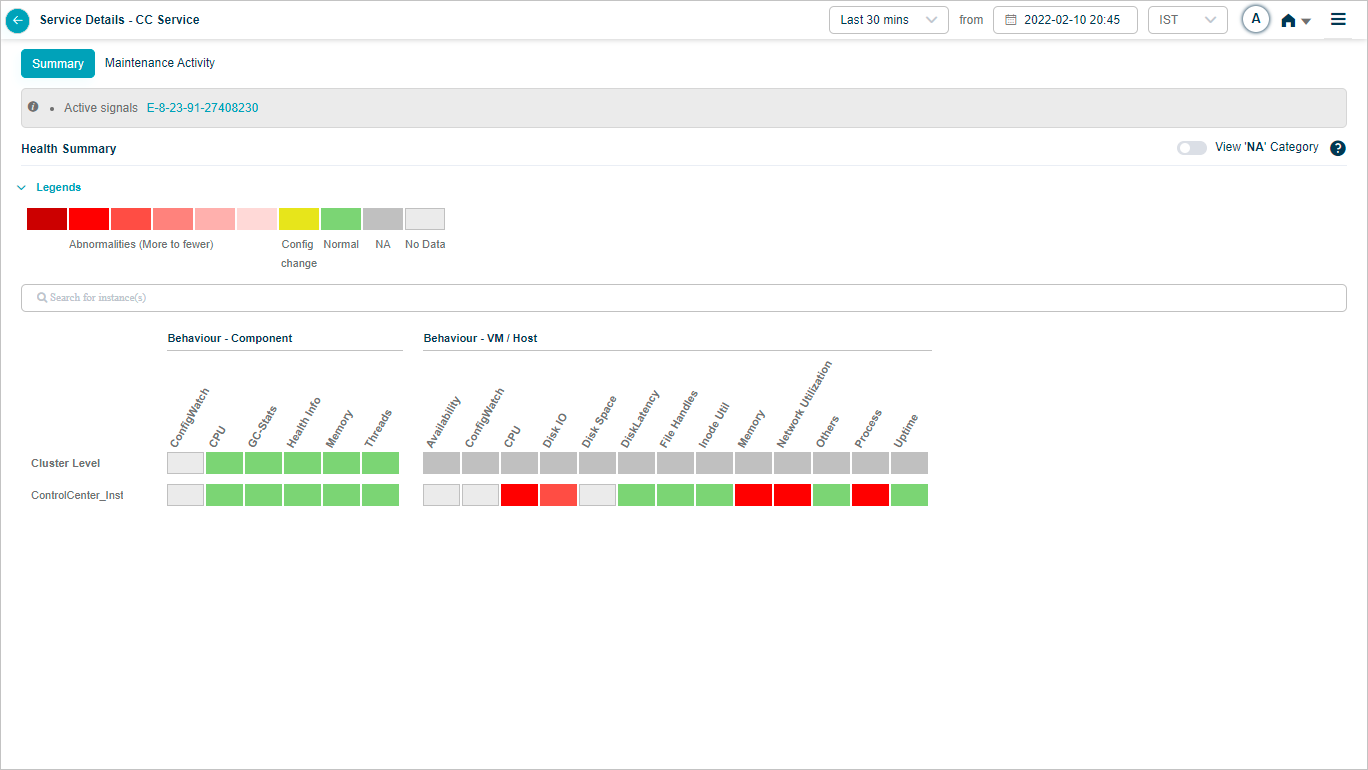
Click any KPI to see its graph.
Supervisor Controller
Behavior of the Supervisor Controller service hosts and components.
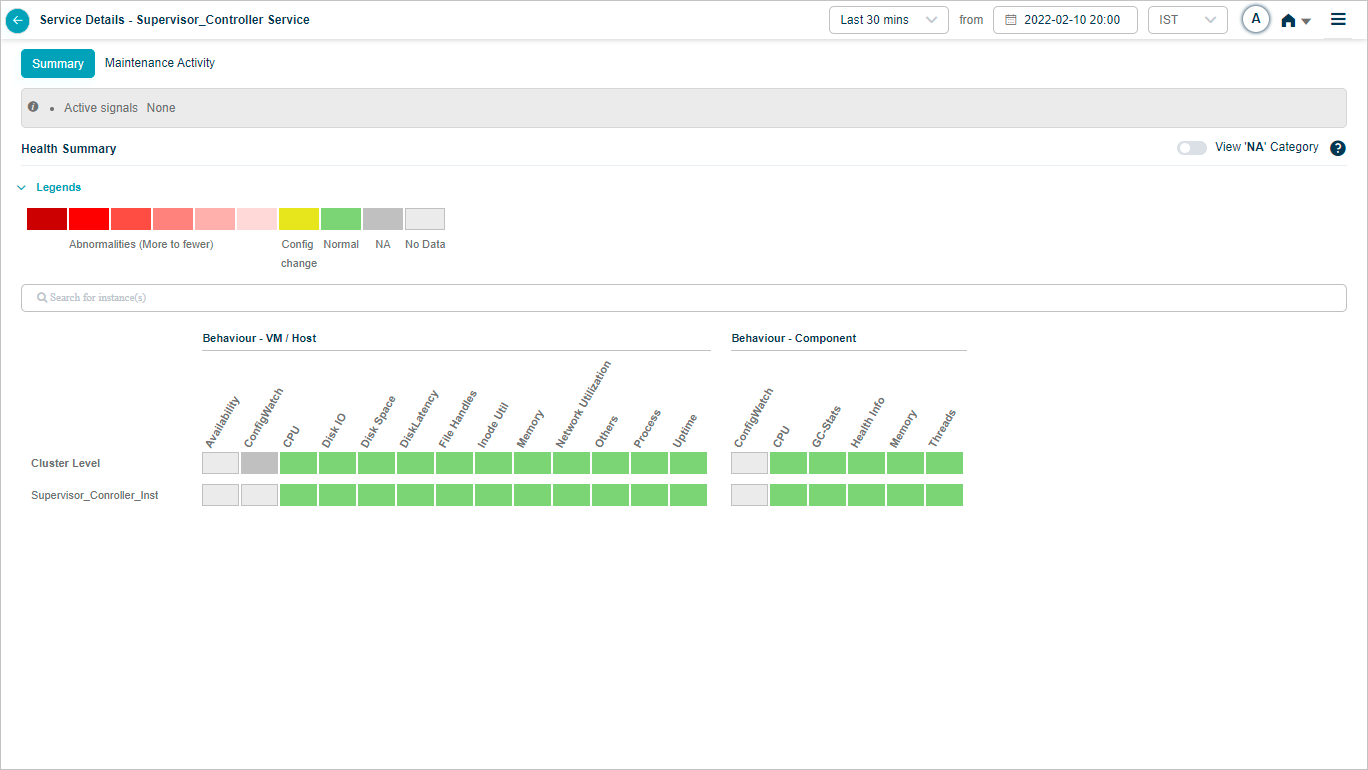
Click any KPI to see its graph.


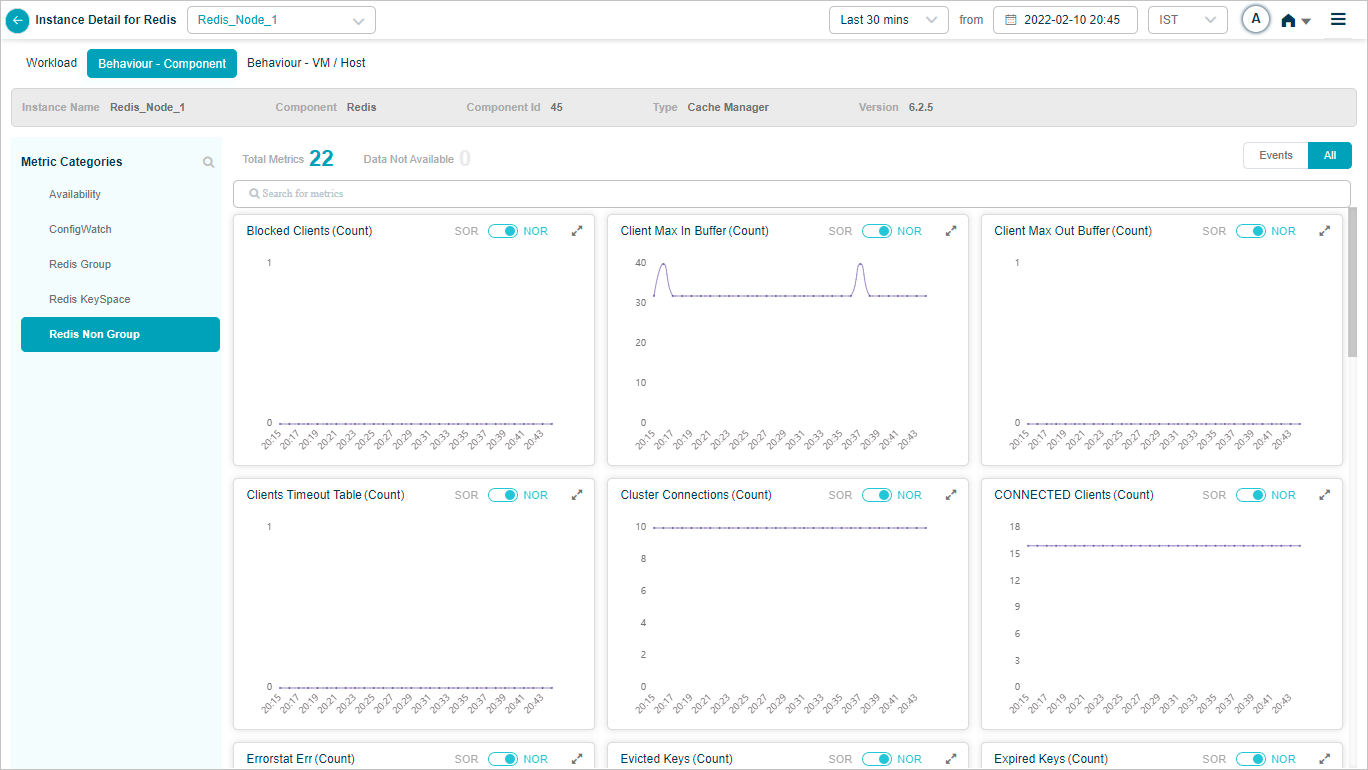
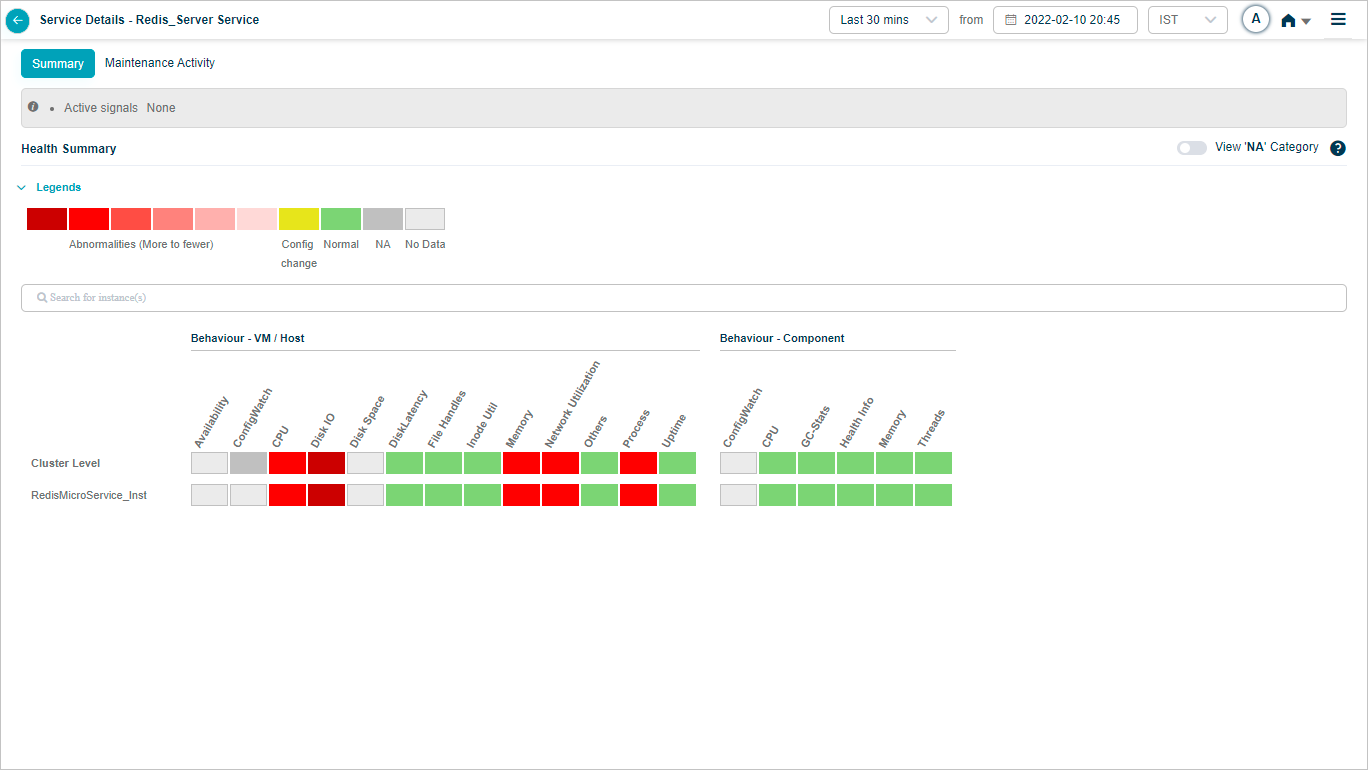
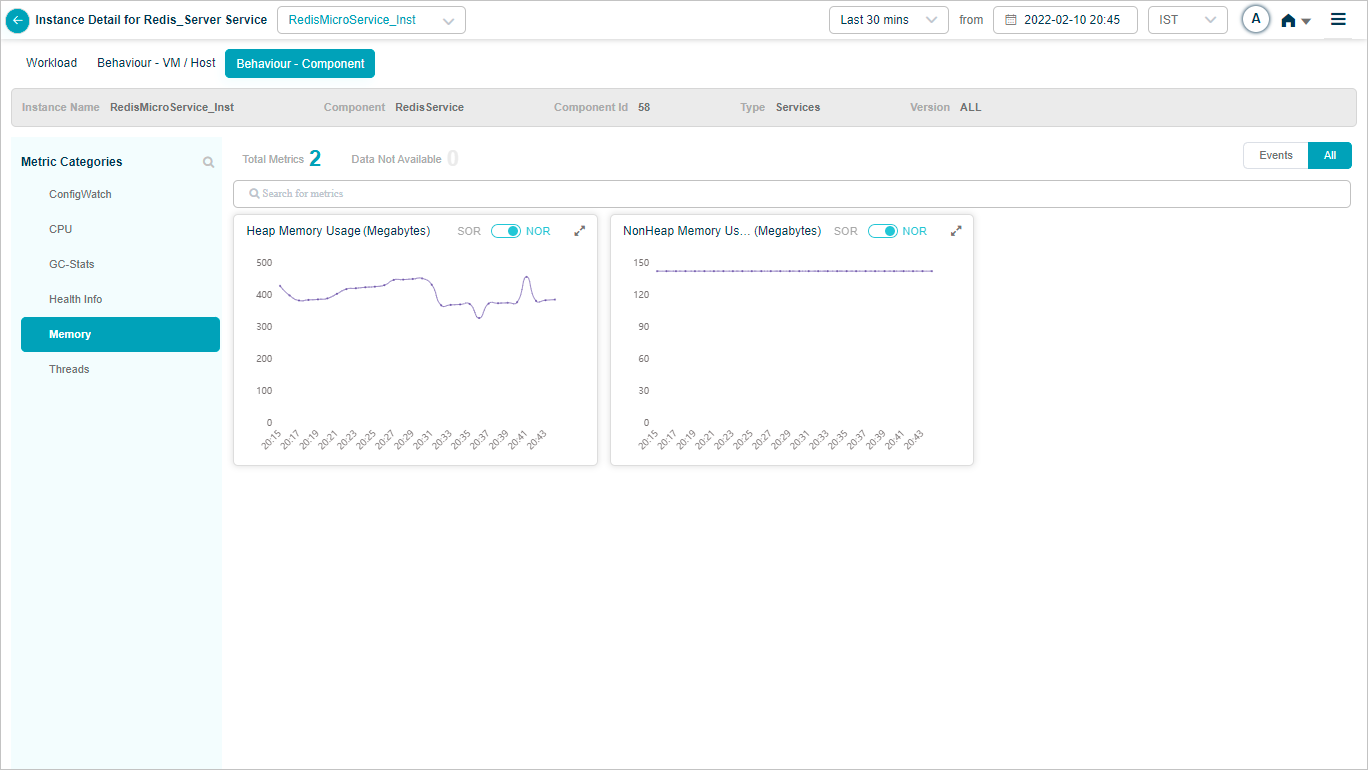
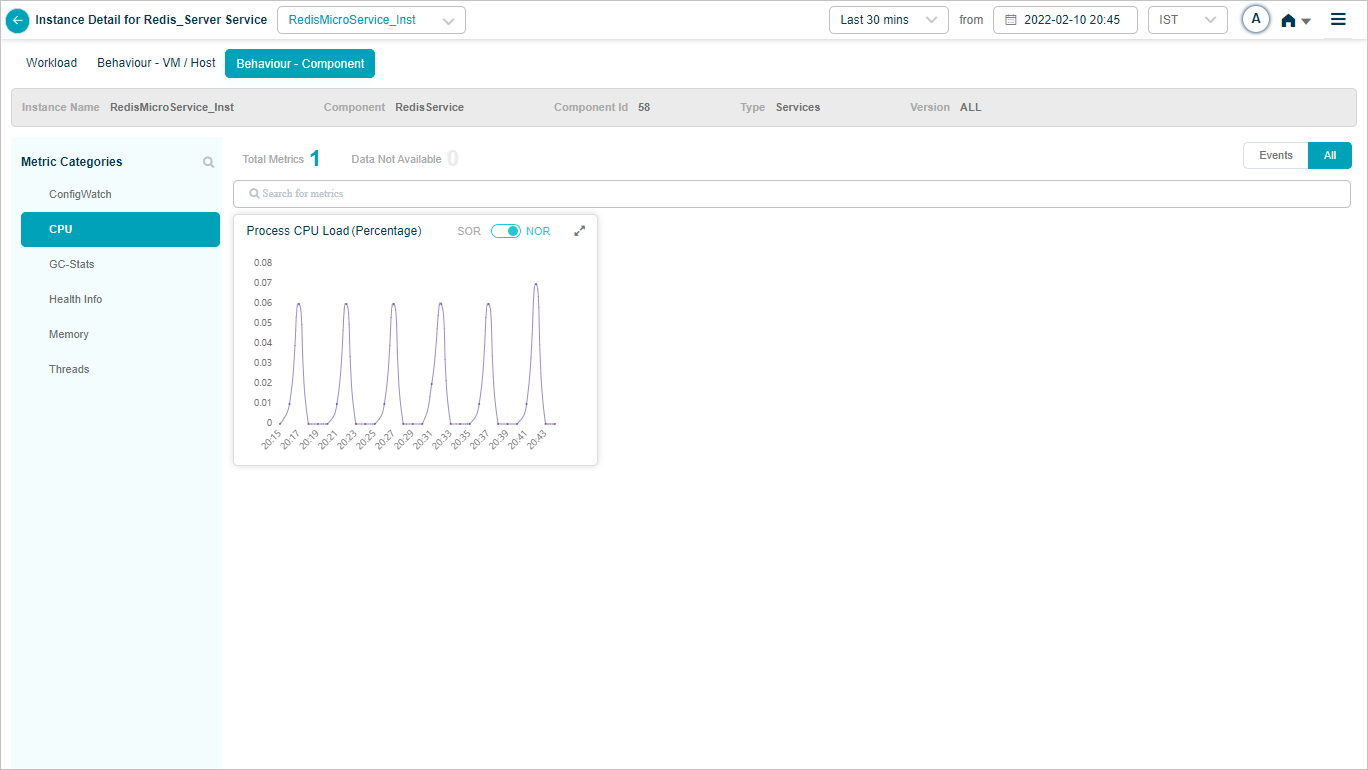
Redis Server
Behavior of the Redis service hosts and components.
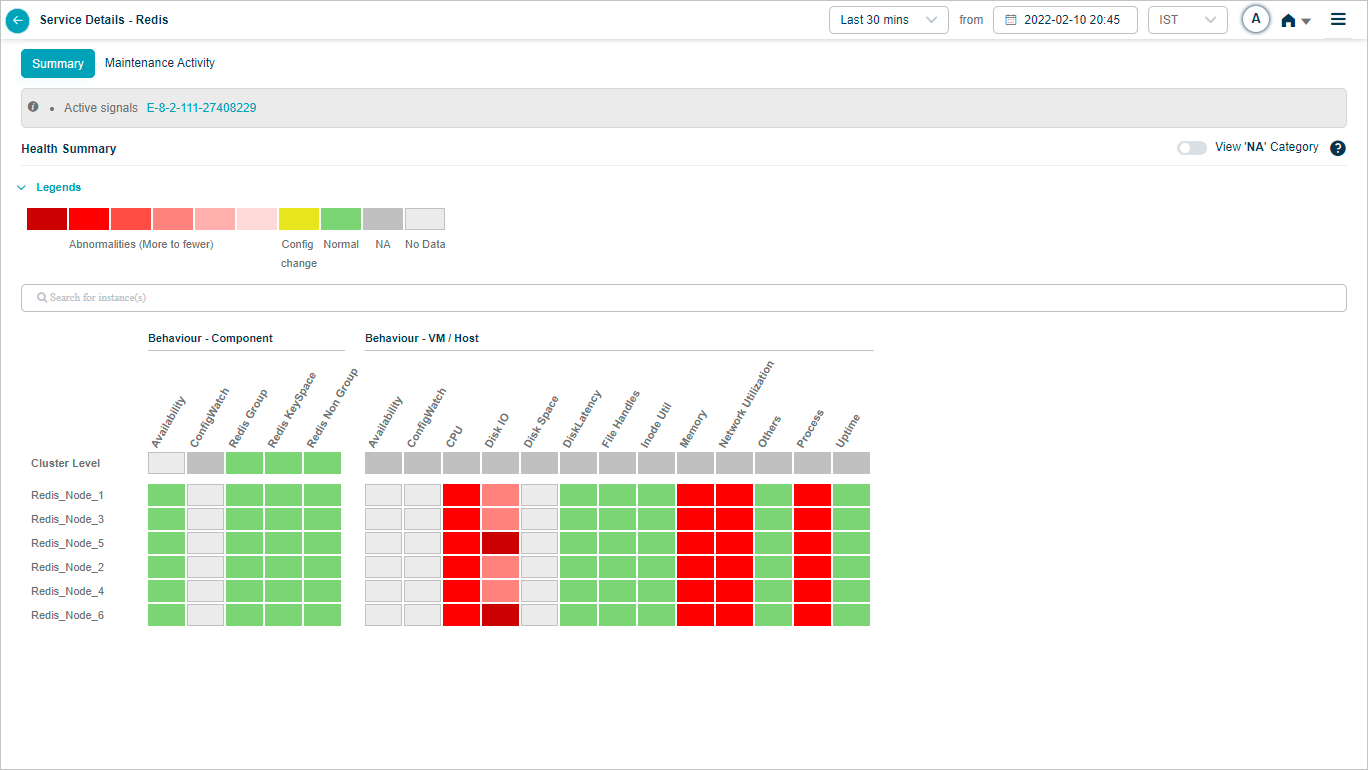
Click any KPI to see its graph.


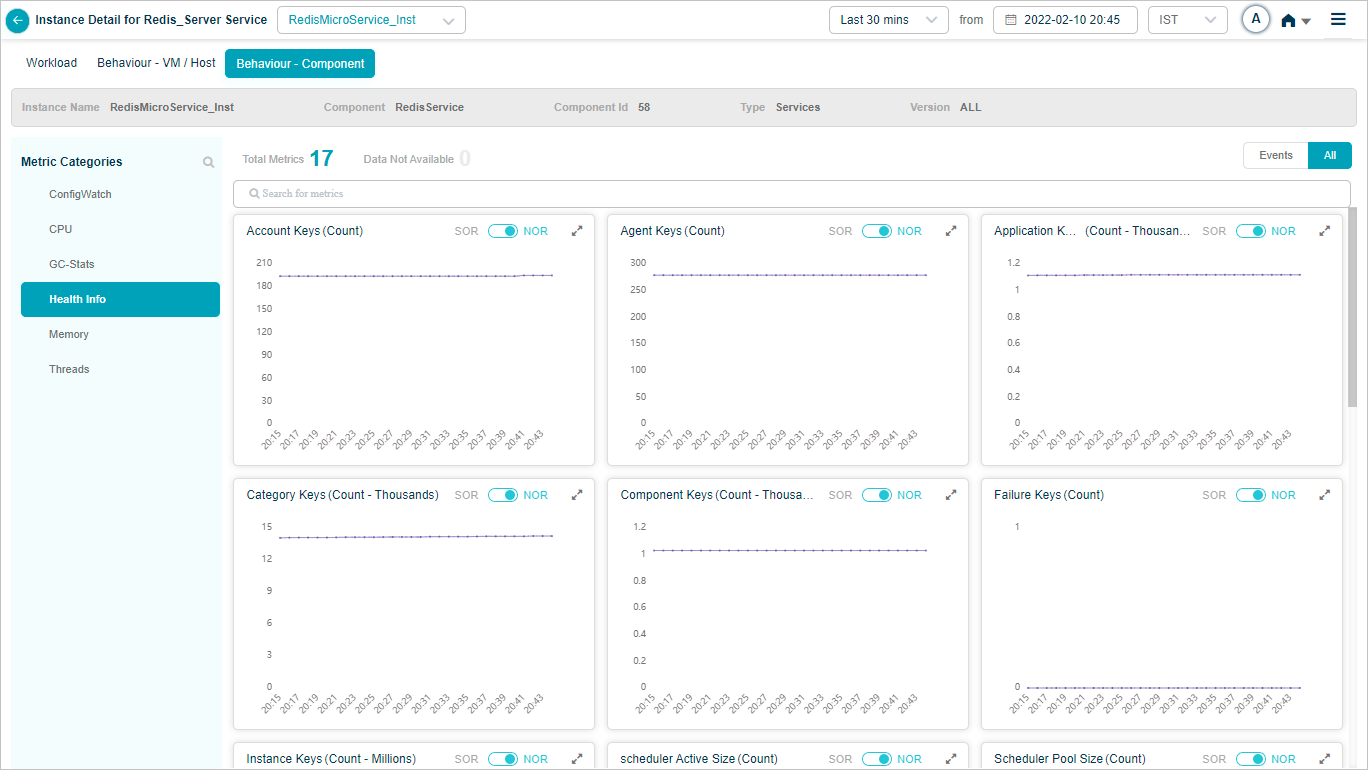
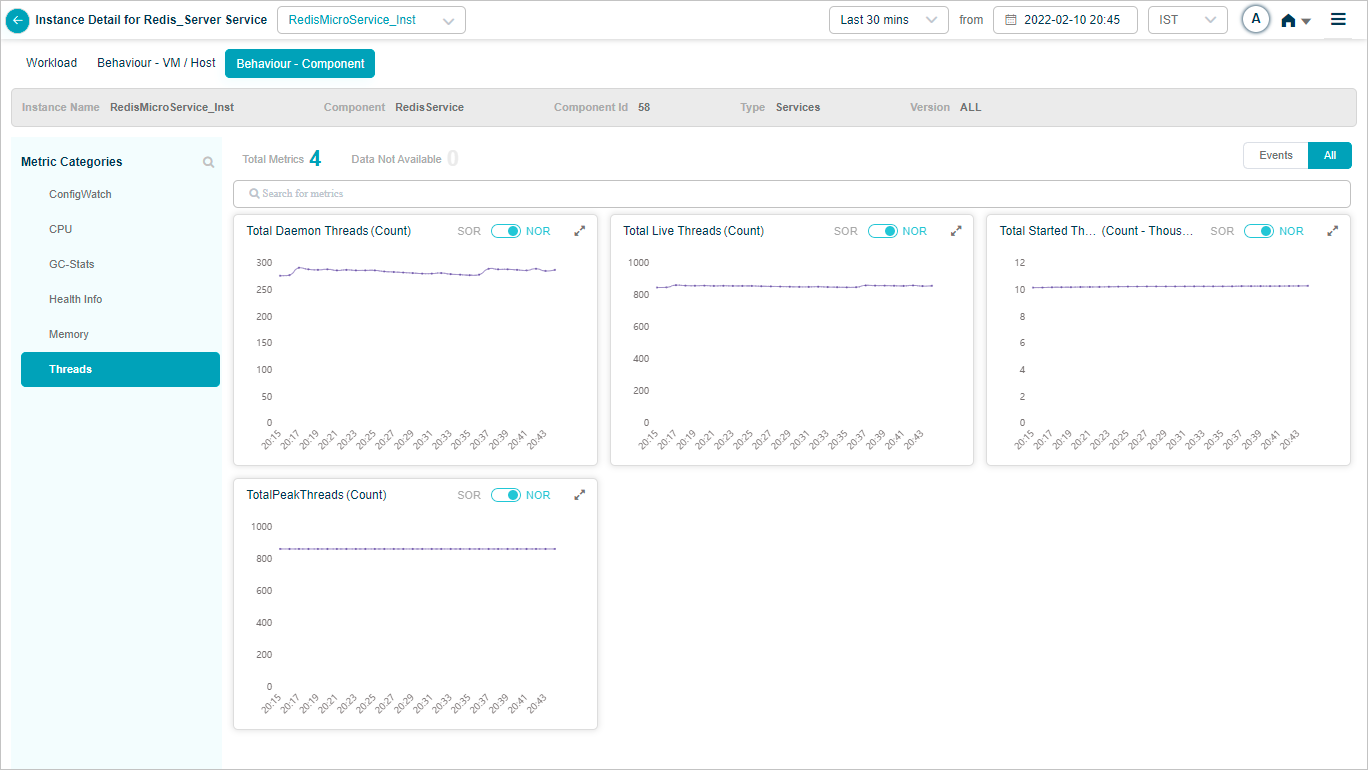
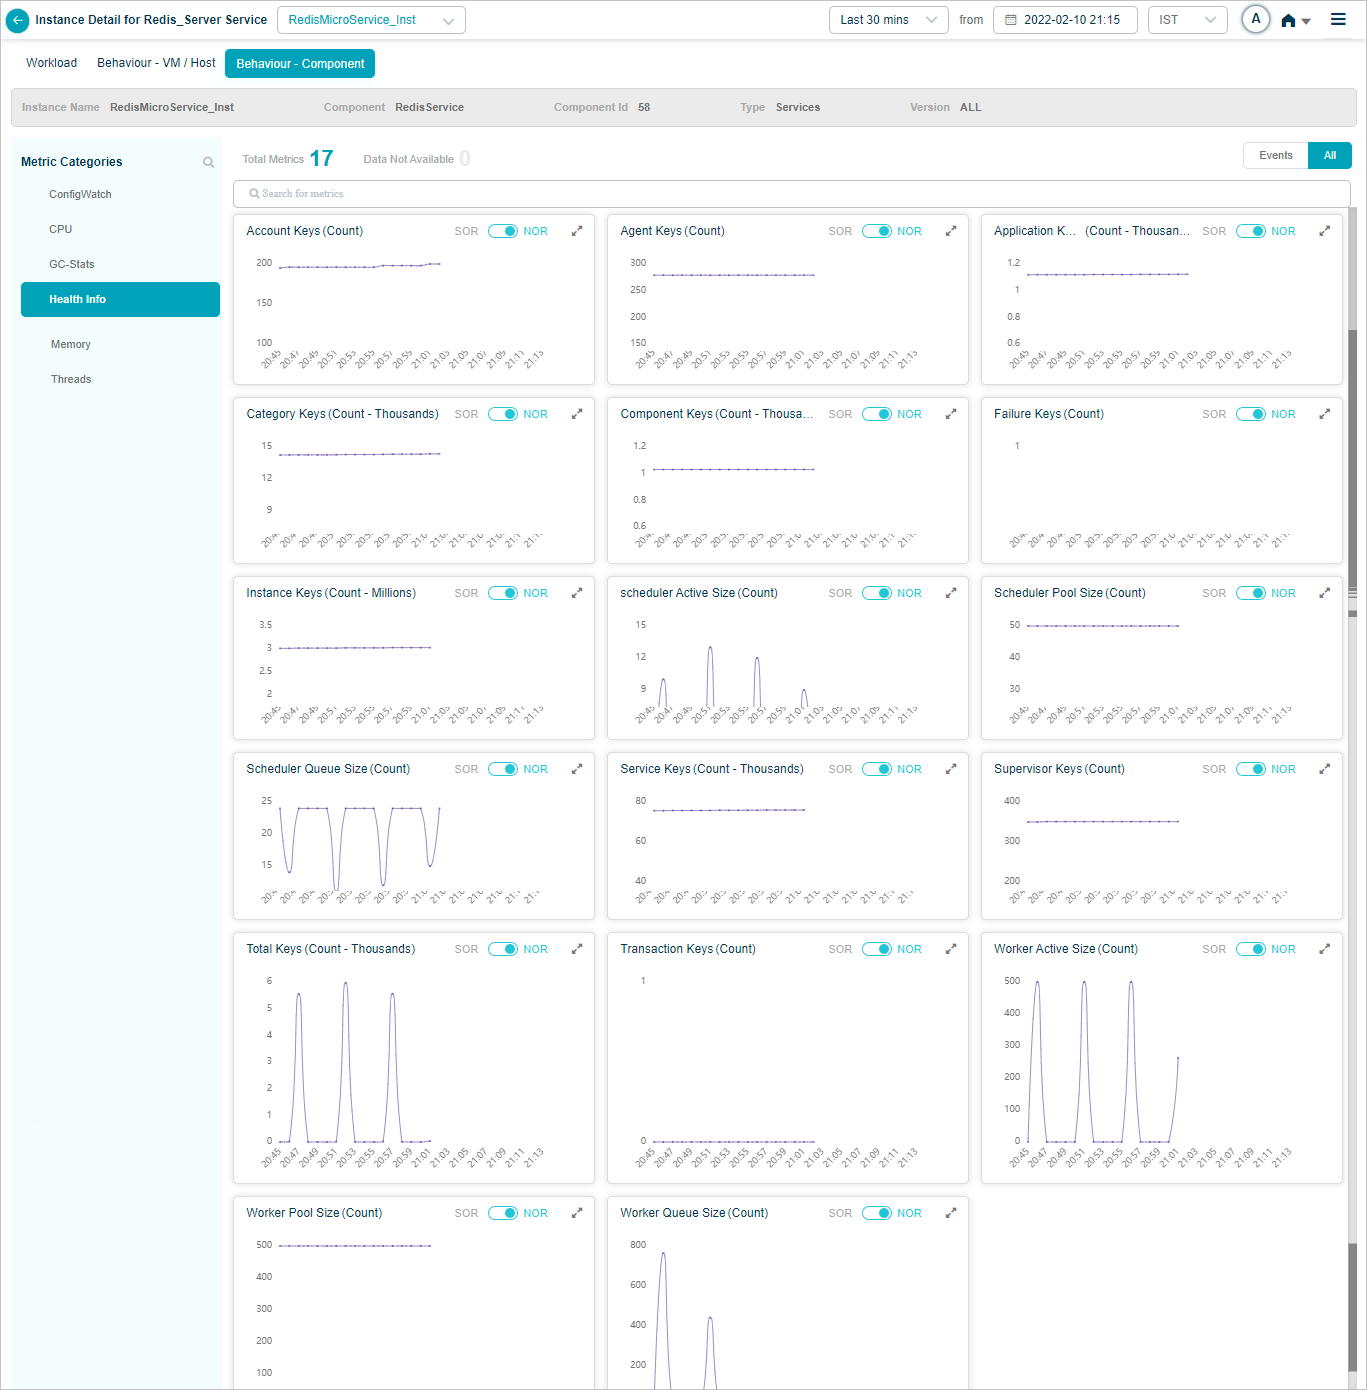
Redis Microservice
Behavior of the Redis Microservice hosts and components.
Click any KPI to see its graph.
Next
- Viewing Application Health . the application-level dashboard.
- Viewing Availability KPI . instance availability over time.
- Viewing Forensics . event-level forensics data.