How Can We Help?
Search for answers or browse our knowledge base.
 Single PDF
 Bulk PDF
 Section
Early Warning helps detect patterns that may indicate potential service outages. HEAL raises an Early Warning when abnormal behavior is observed in one or more services, but the entry-point services are still operating within their SLA.
Early warnings allow teams to act before user-facing issues occur.
When is an early warning triggered?
- When a metric breaches its Normal Operating Range (NOR).
- When transaction volume or request count deviates significantly from historical patterns.
Viewing Early Warning
To view the Early Warning in the HEAL UI:
- Login in to the HEAL UI and click on the Incidents icon (1) in the left-hand menu. The Incident page appears.
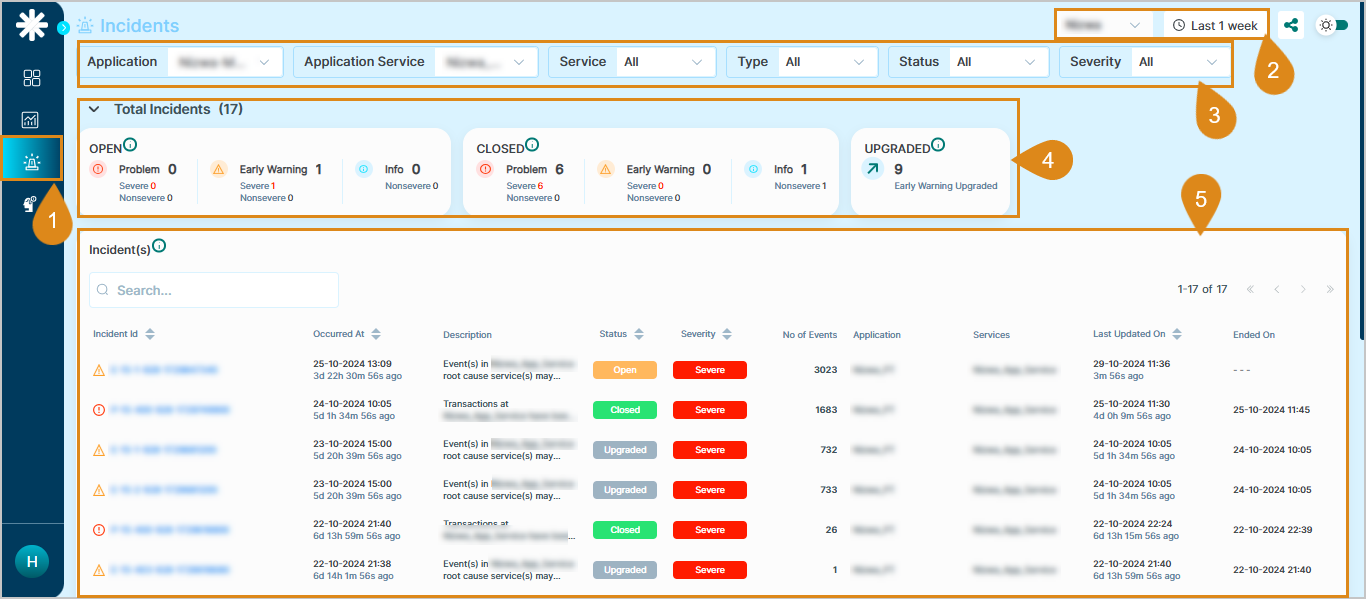
- On this dashboard, select theappropriate service and time duration from the dropdown menus.
- Use the filters to narrow down the results by application, service, type, status, and severity, as needed.
- The Incidents Summary section provides the following details:
-
- Open events: Displays the total number of open events categorized as Problem, Early Warning, and Info.
-
- Closed events: Displays the total number of closed events categorized as Problem, Early Warning, and Info.
-
- Upgraded: Displays the total number of Early Warning events that have been upgraded.
- Below the summary, you’ll find a detailed list of incidents, including Early Warning events. Each entry provides details such as event ID, occurrence time, status, severity, associated application and service, number of events, last updated time, and end time.
Tip: Incident IDs that start with ‘E’ represent Early Warning events. This makes it easy to identify and analyze them directly from the list.