Search for answers or browse our knowledge base.
 Single PDF
 Bulk PDF
 Section
Anomaly detection is the automated identification of patterns in the operational data that deviate significantly from expected behavior.
In HEAL infrastructure, services, microservices, and components generate massive volumes of logs, metrics, and traces: making manual inspection difficult without anomaly detection.
Hence, HEAL’s anomaly detection engine supports both real-time streaming data and historical batch analyses, giving you the flexibility to detect issues as they happen and before they cause outage.
An anomaly detection capability helps the platform with the benefits below:
- Continuously sets the baselines.
- Automatically generates anomaly when there is a breach in real-time.
- Reduce noise and false detections.
- Send the alert before the outage.
Viewing Anomalies
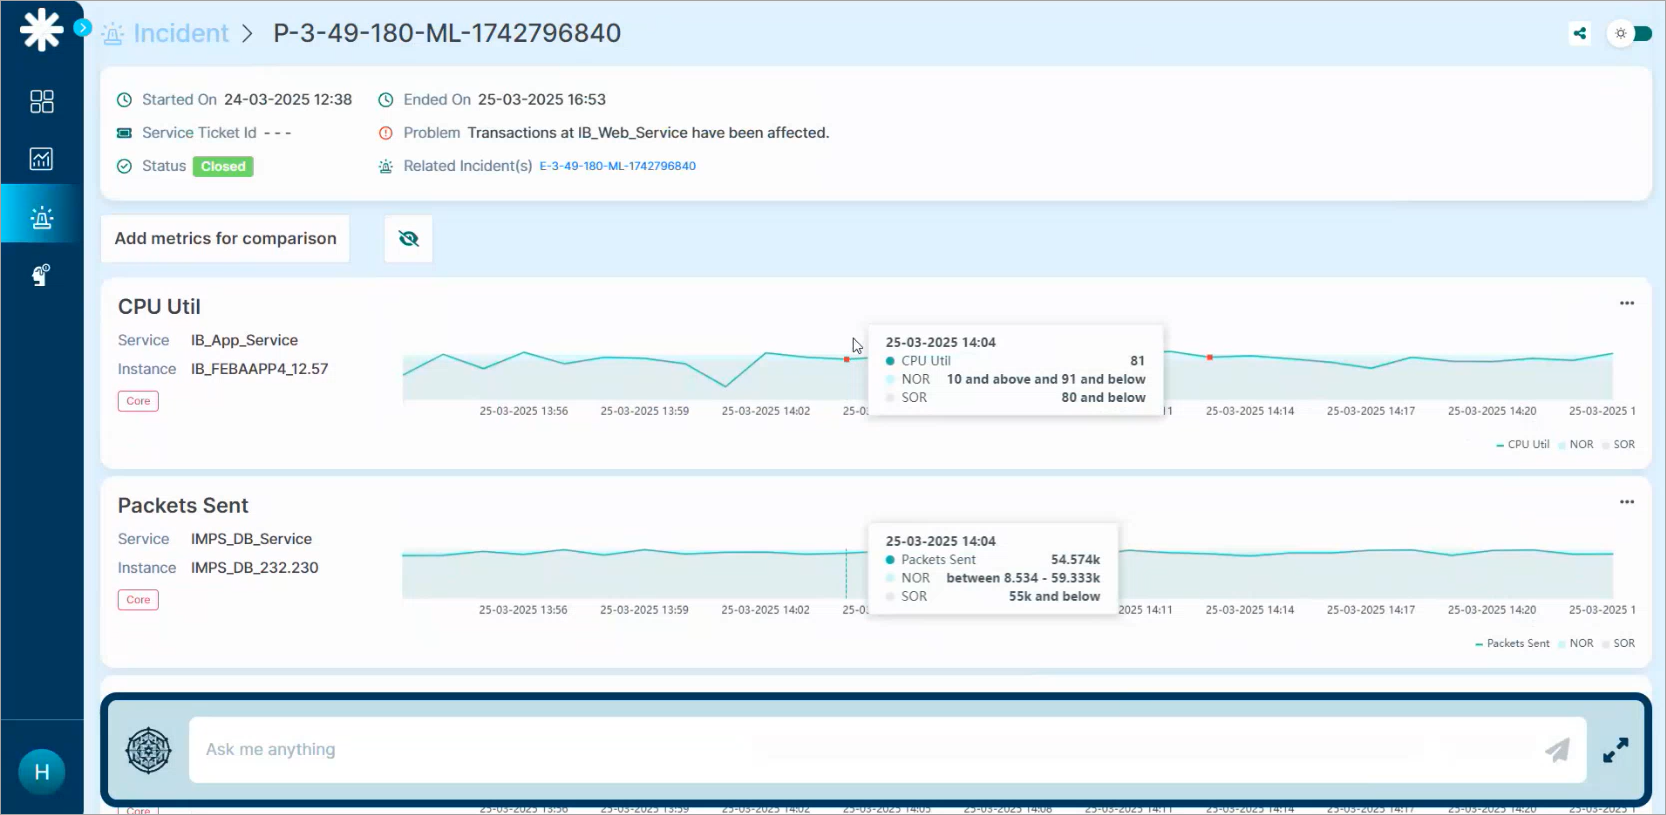
When you navigate to an incident page in the HEAL UI:
- Scroll down to the metrics section to view graphs of impacted metrics.
For example: CPU Util , Packets Sent
- Red dots on the graphs indicate anomalies (i.e., events detected by the AD engine).
- Hover over a red dot to view detailed anomaly context, including:
- NOR (Normal Operating Range)
- SOR (Safe Operating Range)
4. Click on the red dot (anomaly); the Event Details page will pop-up with the Forensic Details
