Search for answers or browse our knowledge base.


Event Correlation links related alerts and anomalies into one actionable incident. Instead of drowning teams in raw events, HEAL groups them by pattern, topology, and telemetry to cut alert fatigue.
How it works
- HEAL continuously analyzes telemetry, anomalies, and KPI trends.
- When patterns line up, events are stitched into a single correlated incident.
- Duplicate, redundant, or low-impact events are filtered out automatically.
- Incidents are shown in a correlation graph with event sequences and root cause paths.
The goal is meaningful incidents, not isolated alerts.
Use the Event Graph
The Event Graph appears below the root cause summary on the incident page. It shows the flow of every event linked to that incident.
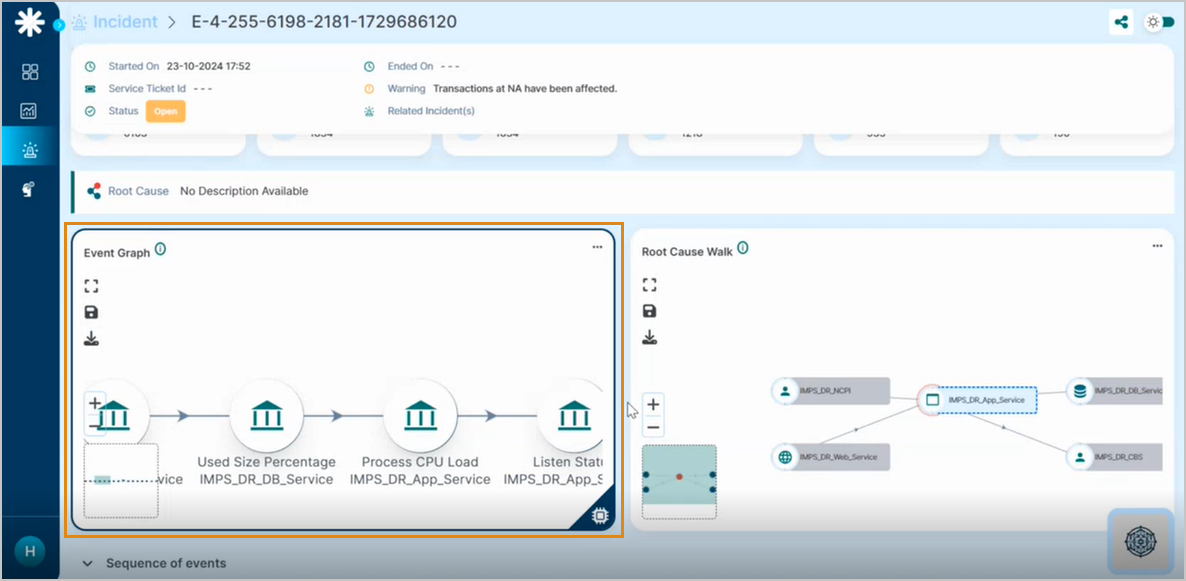
Hover any node to see the event description, KPI values, and event scores.
Identify severity. High-impact events are highlighted.
View event sequence. Track how anomalies evolved over time.

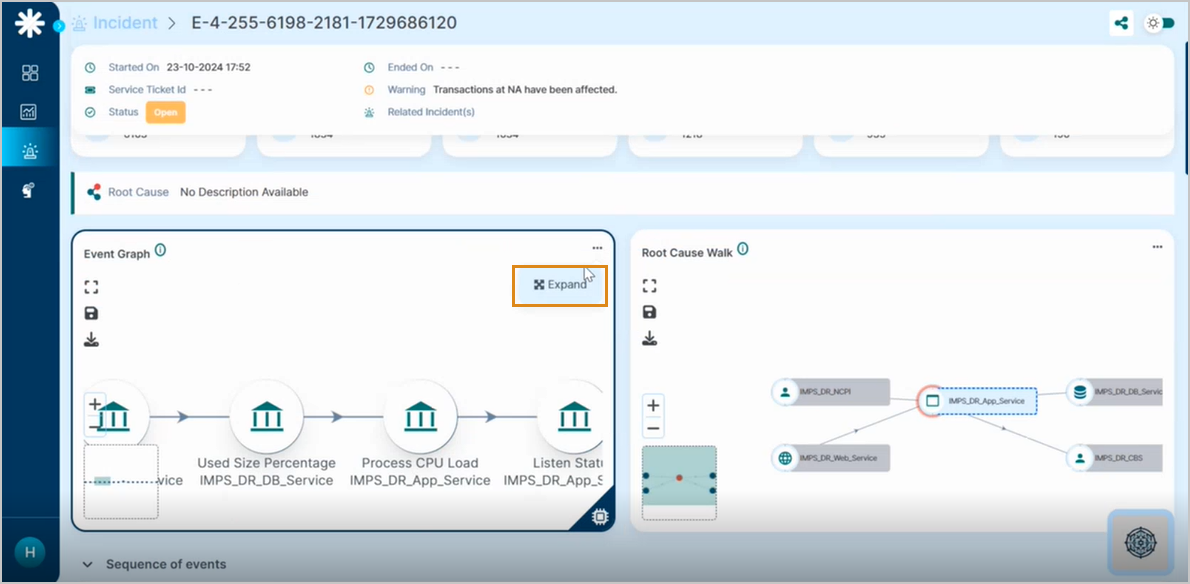
Expand the graph
1. Click the three dots in the upper-right corner of the Event Graph.
2. Select Expand.
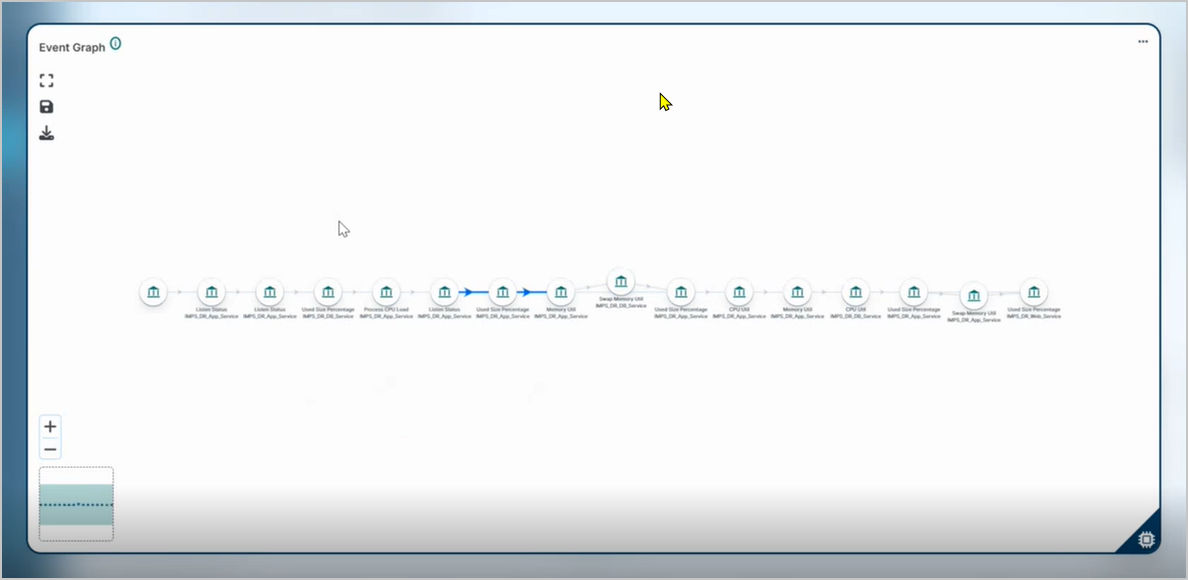
3. The full graph opens in a wide view.
Use the expanded graph to inspect long event chains and cross-service anomalies.
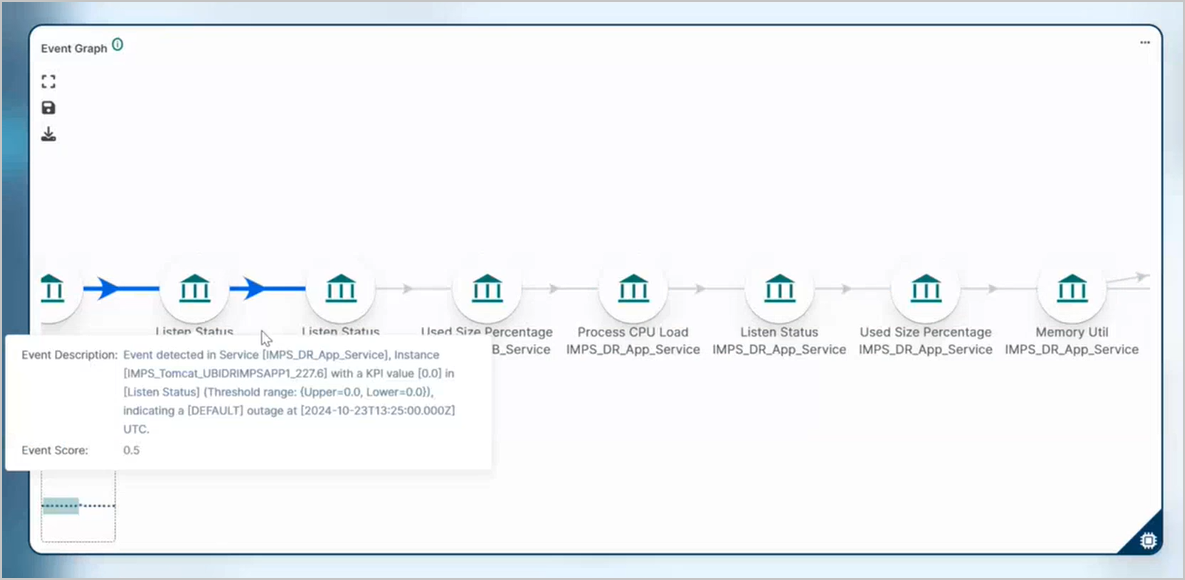
Hover any node in the expanded graph to see the full correlation data for that event.
Next
- Root Cause Walk . the service-level impact graph.
- Anomaly Detection (AD) . how HEAL spots deviations.
- Incident Details . open one incident.