Search for answers or browse our knowledge base.


The Machine Learning Engine (MLE) finds the most important metrics for an account or application. The ML Insights dashboard shows them in a graph and ranks them using a relevance score.
How relevance is calculated
The MLE pulls data from Cassandra tables and saves results in CSV. It then computes two scores from the past 30 days, both normalized between 0 (least important) and 1 (most important).
Impact score. The likelihood (conditional probability) that a metric causes a problem signal when the MLE detects a violation in its value.
Significance score. How often variations in the metric value lead to an event.
Relevance score formula.
Relevance Score = 1 + Impact Score
else:
Relevance Score = Significance Score
Open ML Insights
Click ML Insights in the top navigation. Services and instances are sorted by relevance score (highest first), so the dropdowns default to the most relevant entries.
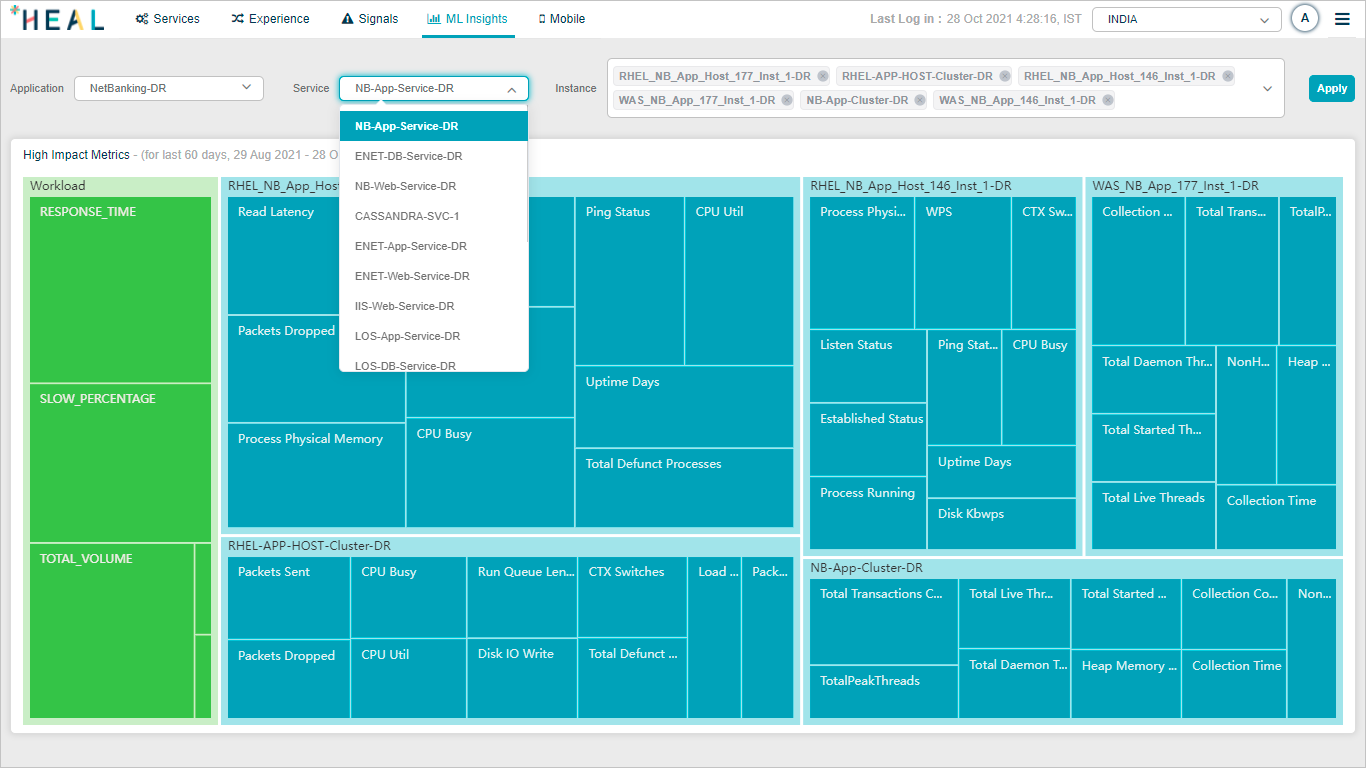
View top metrics
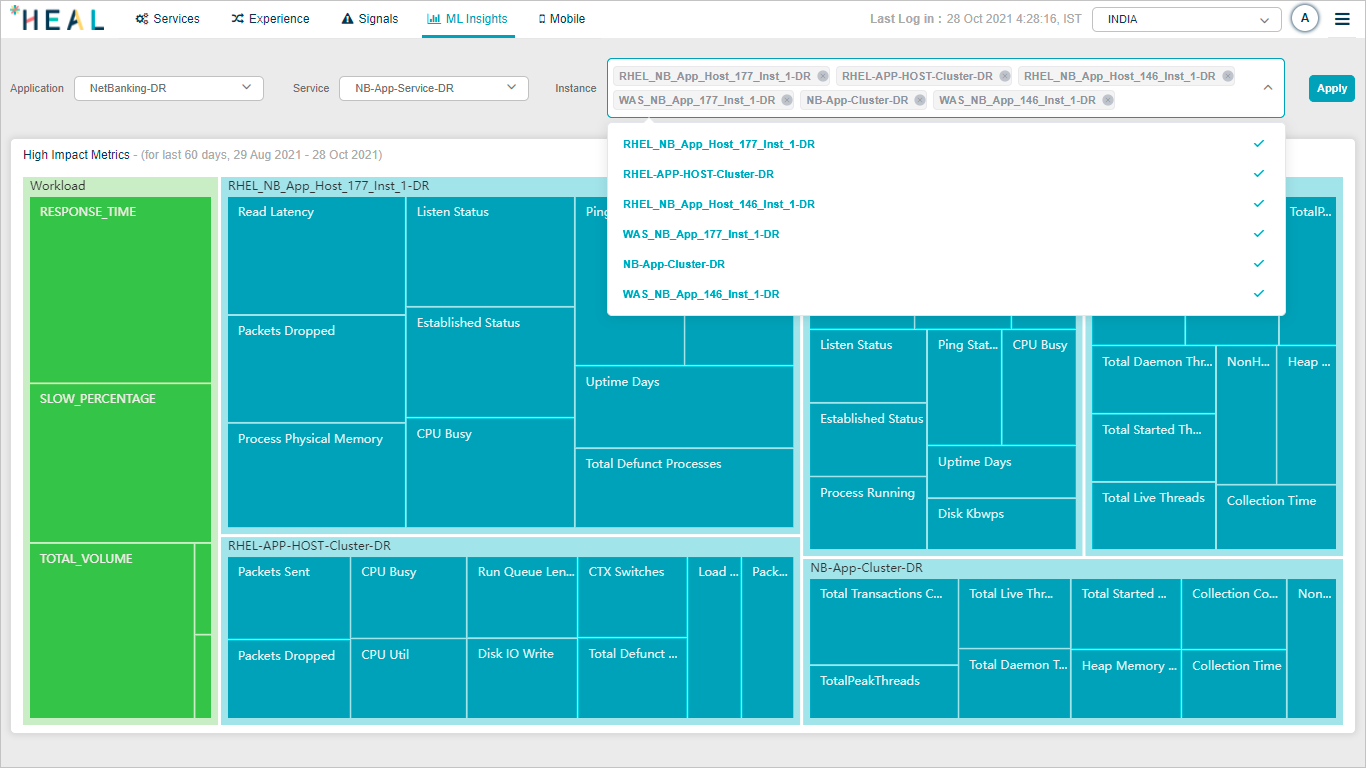
Pick the application, service, and one or more instances, then click Apply. HEAL shows the top 10 most important metrics for the selection. Each instance is one pod, with the top 10 behavior metrics shown per instance plus the top 10 workload metrics.

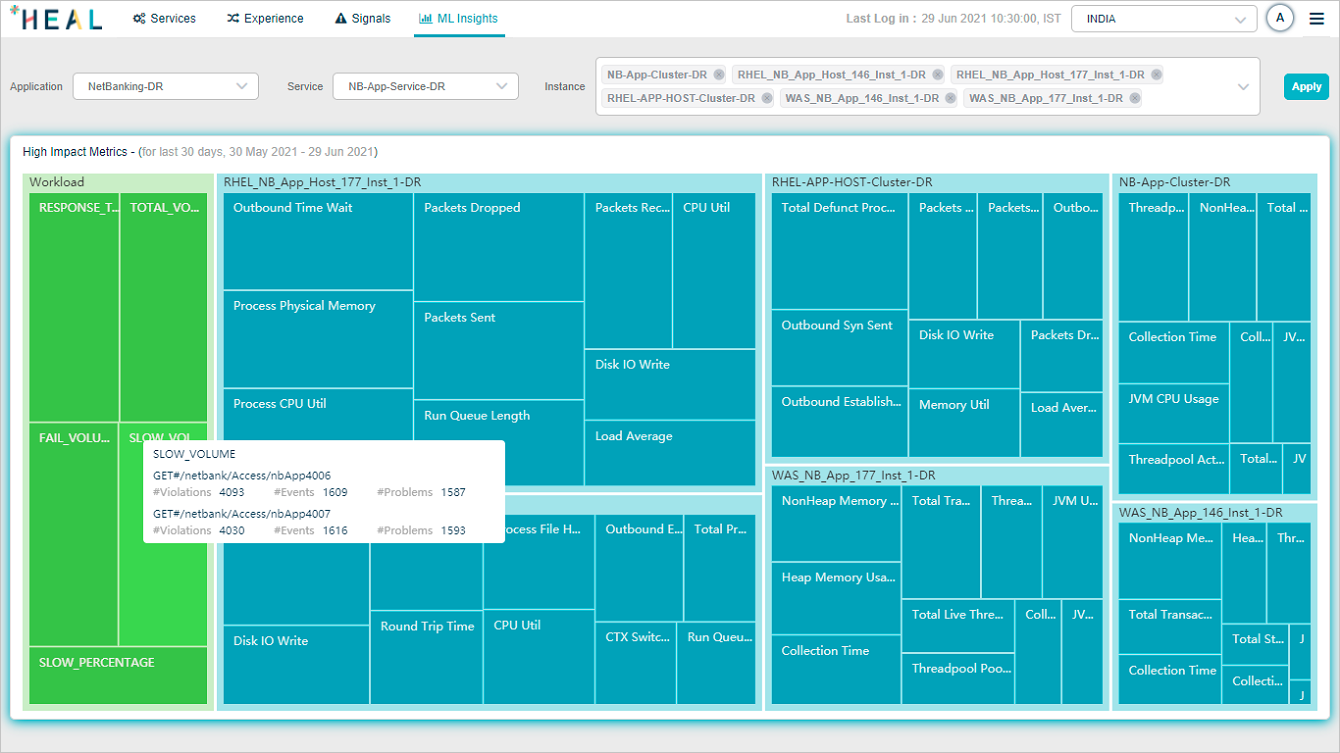
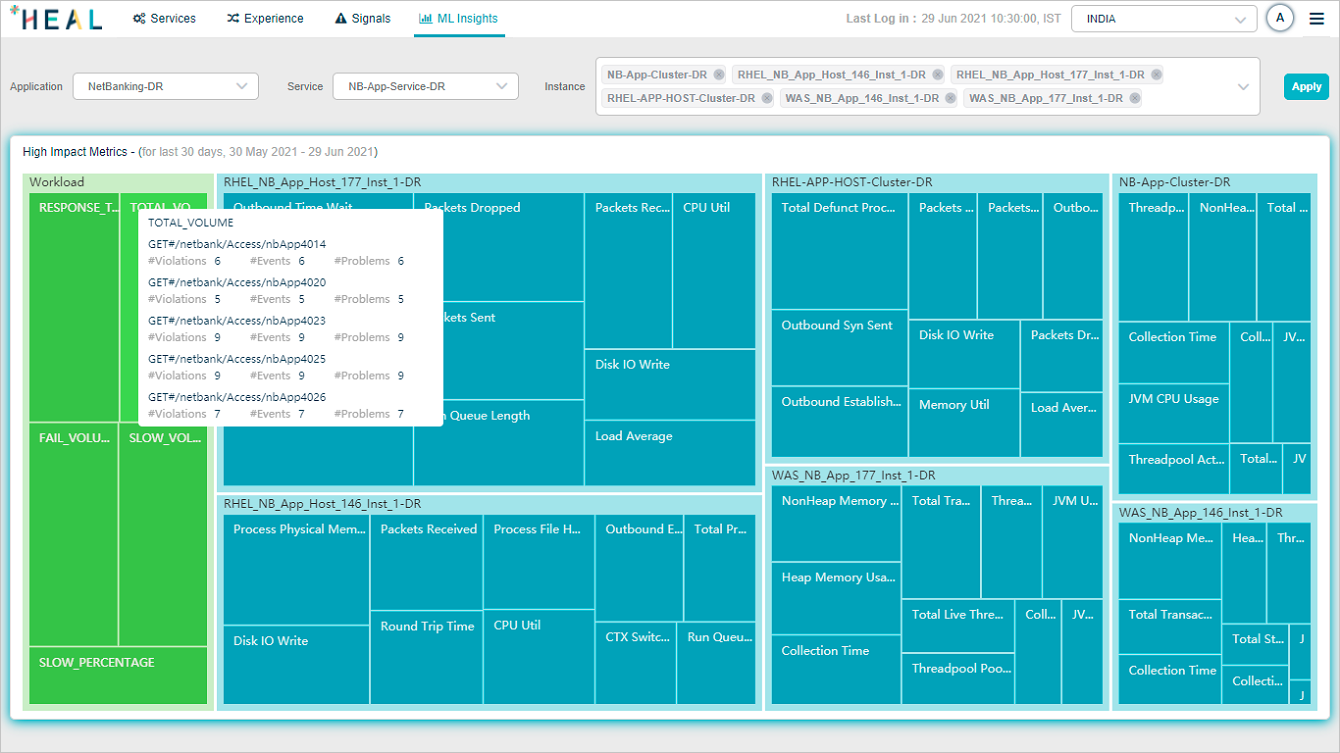
Workload metrics
Hover any workload metric section for details.
Total Volume. Top five successful transactions with the highest impact value.
Response Time. Top five transactions with the highest response time and impact value.
Failed Volume. Top five failed transactions with the highest impact value.
Slow Volume. Top five slow transactions with the highest impact value.
Slow Percentage. Top five transactions with the highest slowness percentage and impact value.

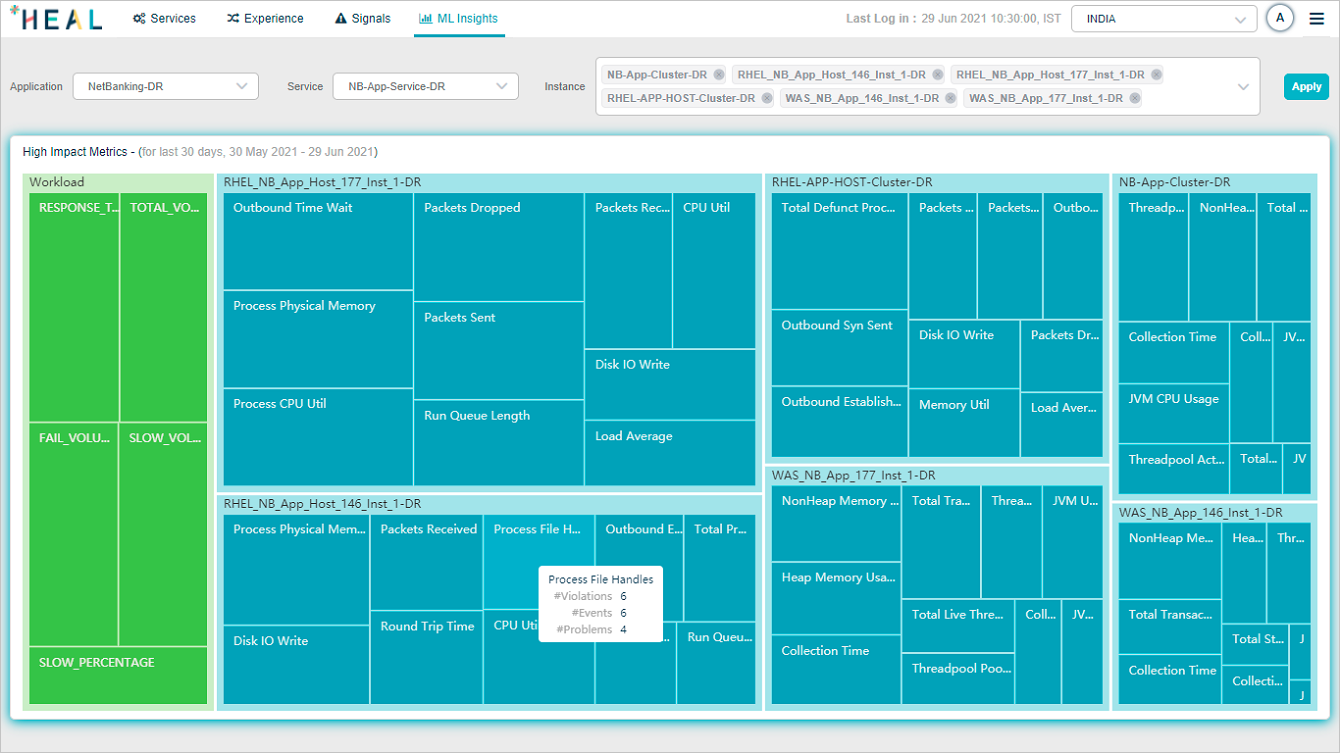
Behavior metrics
Hover any behavior metric section in an instance pod to see the number of violations, events, and problems linked to that metric.

No high-impact metrics
If the selected instances have no high-impact metrics, the dashboard shows this view.

Next
- The Reports Tab . generate, download, and email reports.
- View ML Insights . the Signal tab’s ML Insights view.
- Navigating Signal Tab . problems and early warnings.