Search for answers or browse our knowledge base.


Reports pull detailed data on application, infrastructure, and service performance and behavior. Output is available as PDF, CSV, XLS, or HTML.
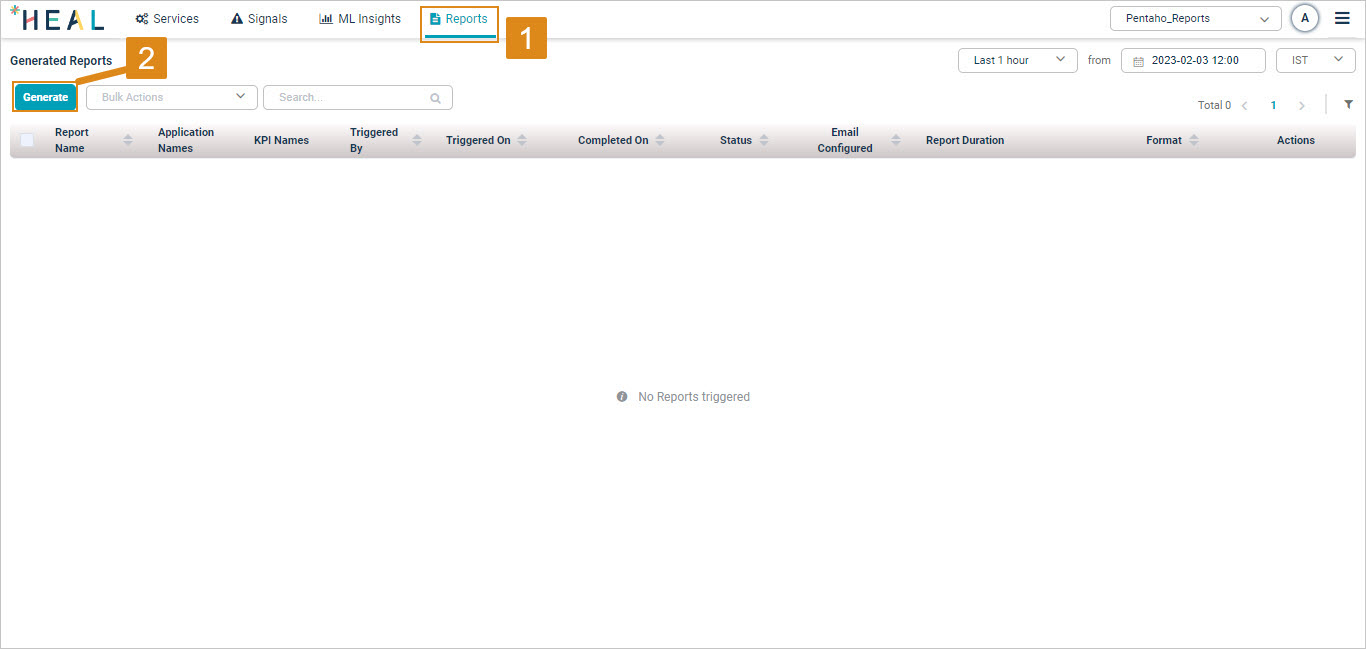
Generate a report
1. Open Reports on the CXO dashboard and click Generate.
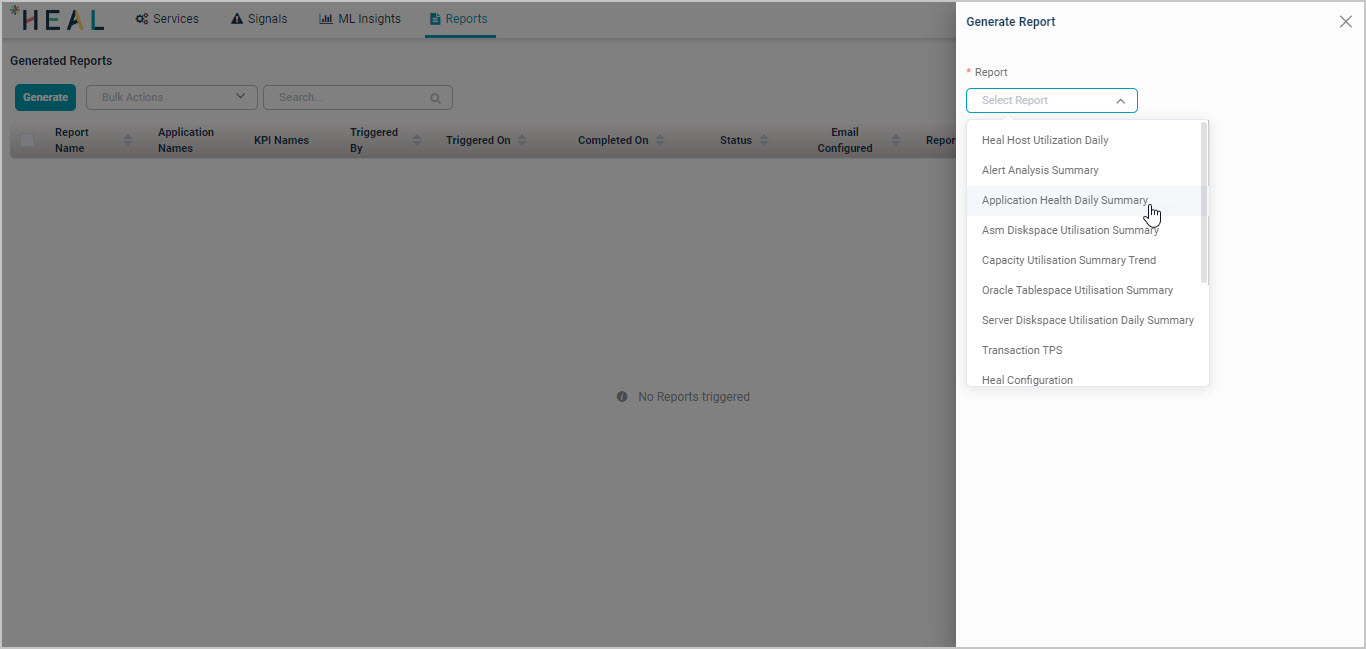
2. Pick the report from the Report dropdown in the Generate Report window. See Report types below for what each one covers.
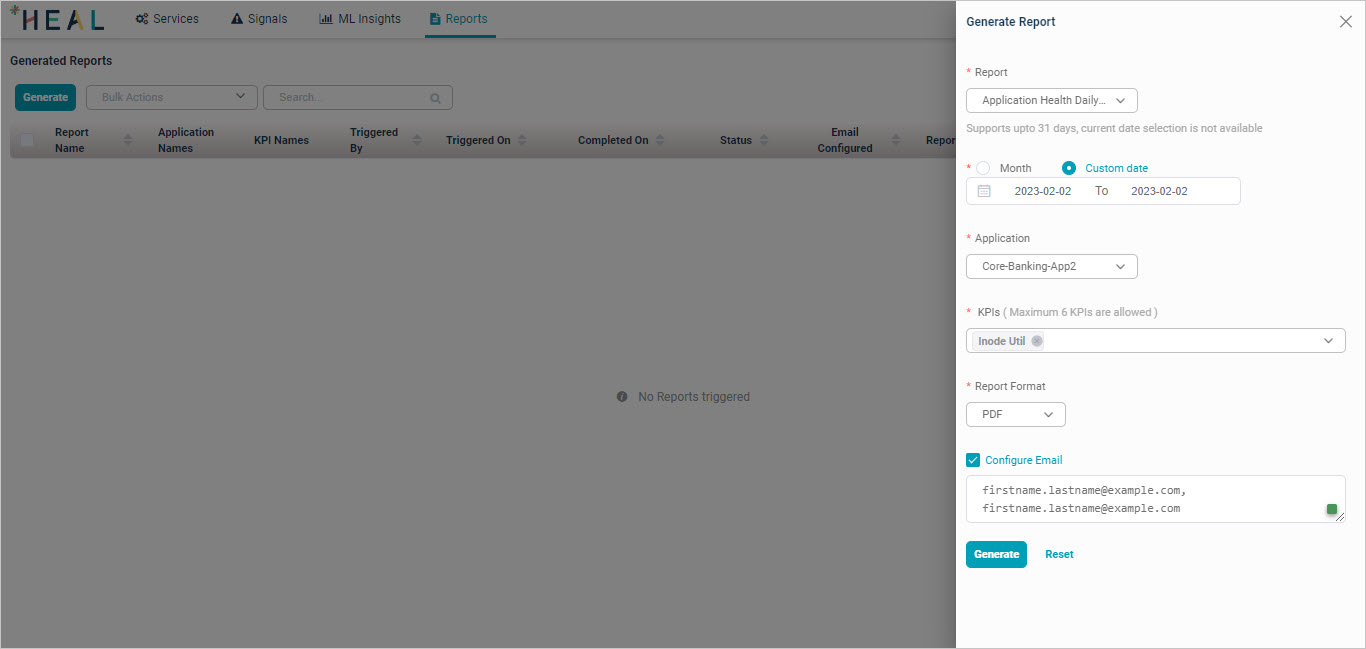
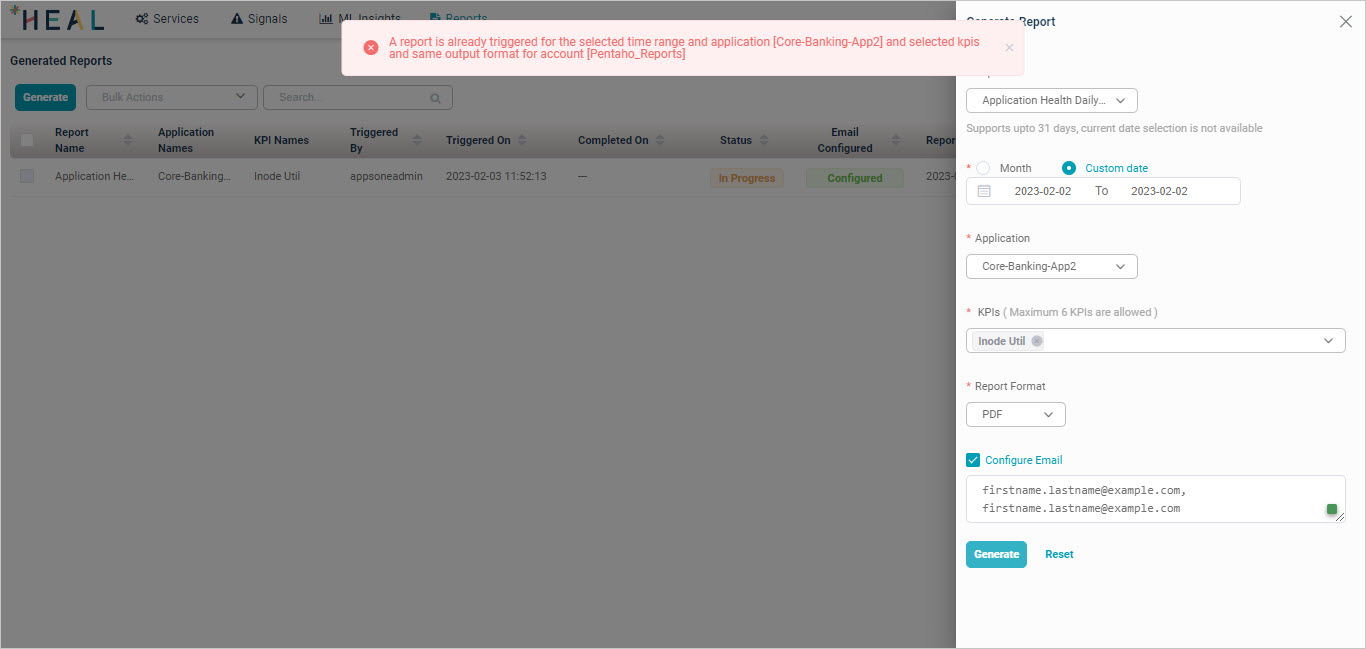
3. Fill in the details and click Generate.
- Click Reset to clear the fields and start over.
- Pick Month for a monthly report or Custom date for a specific time period.
- Pick the Application.
- Pick the KPIs (when needed for the report).
- Pick the Report Format (PDF, CSV, XLS, or HTML).
- To email the report, click Configure Email and enter one or more email addresses (separated by commas). Add SMTP details for your account first.
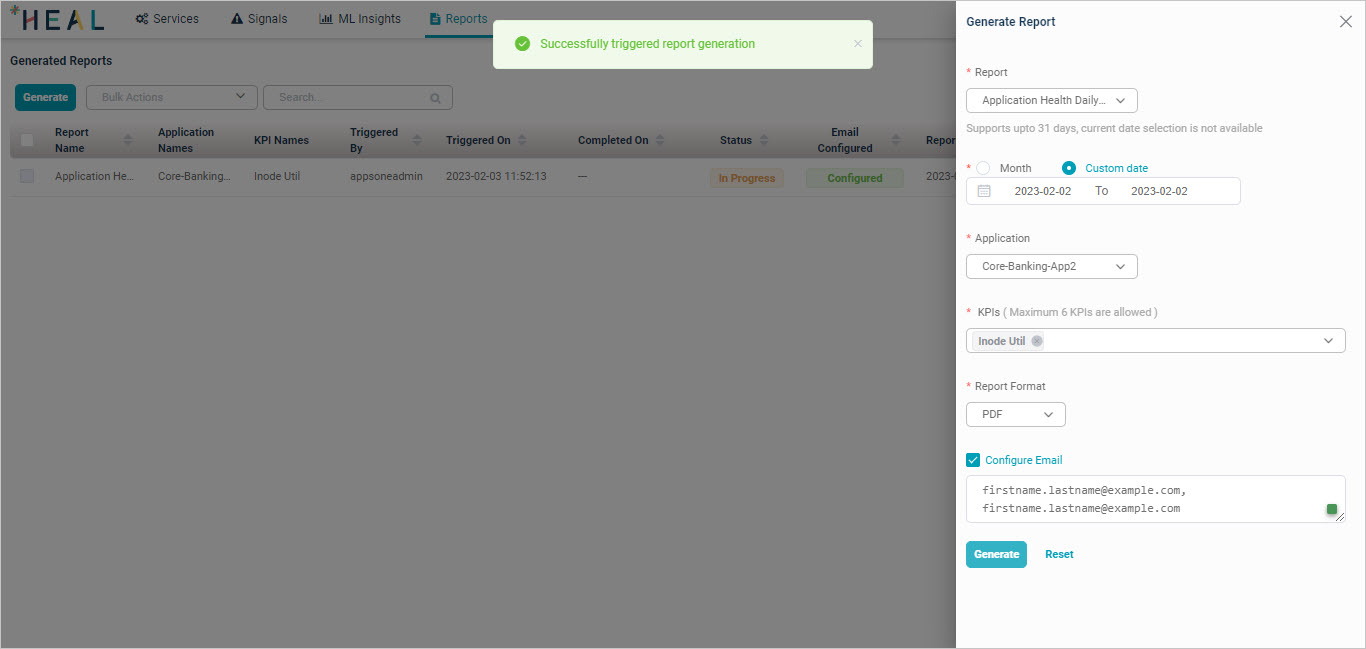
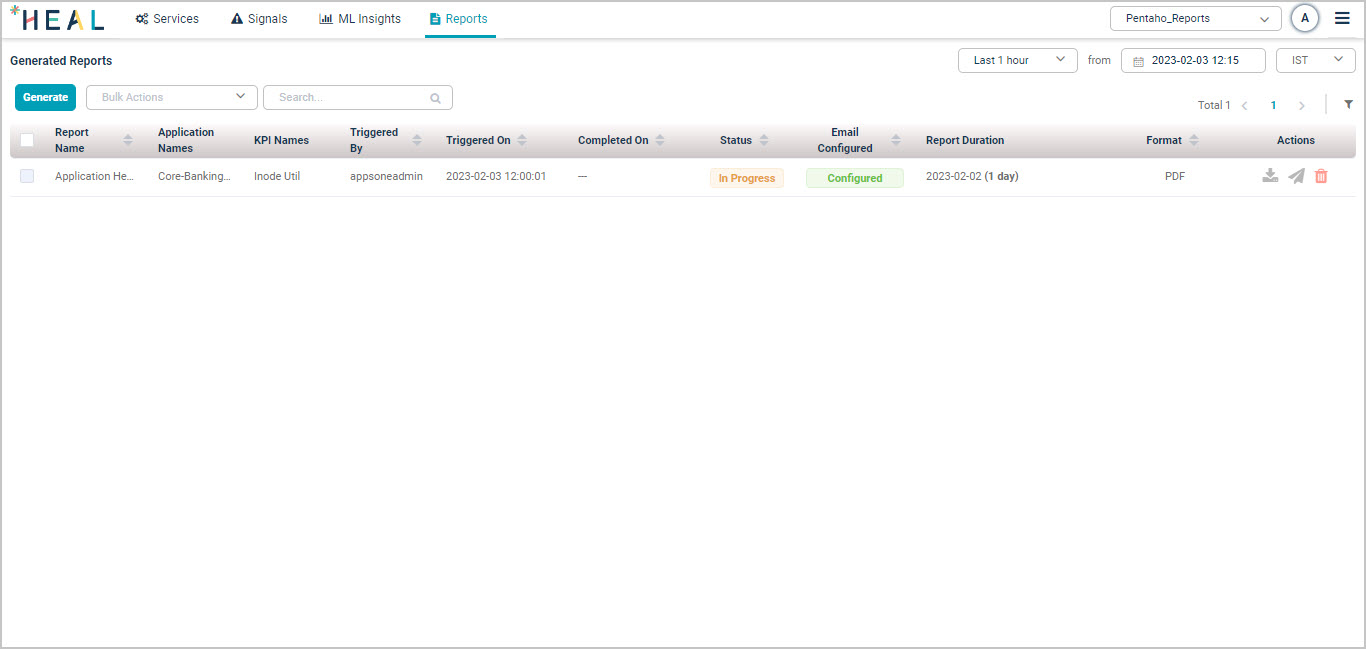
4. Confirmation. The message “Successfully triggered report generation” appears once the job starts.
5. Already-triggered reports. If a report exists for the same time period, application, and output format, you cannot trigger it again. You will see this error. Adjust the configuration and try again, or delete the existing report and start over.
Download a report
1. Watch the status. The Generated Reports page shows In progress while the job runs.
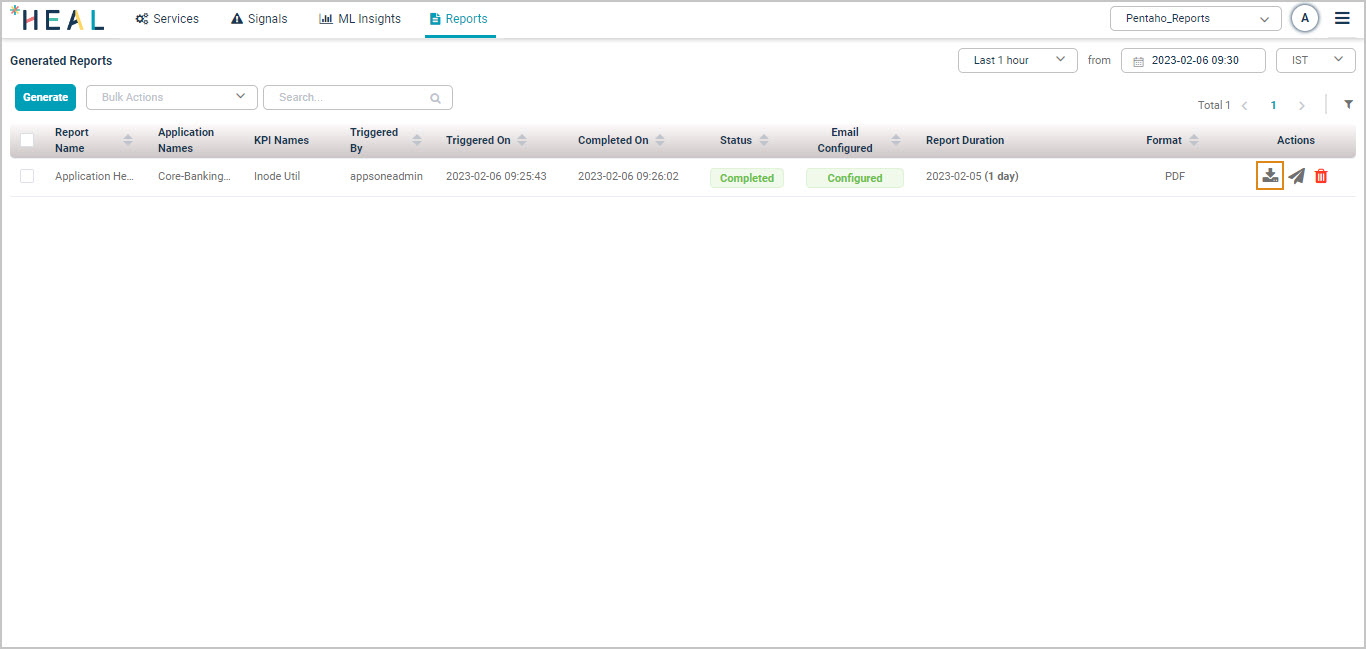
2. Click the download icon ![]() in the Actions column once the status flips to Completed.
in the Actions column once the status flips to Completed.
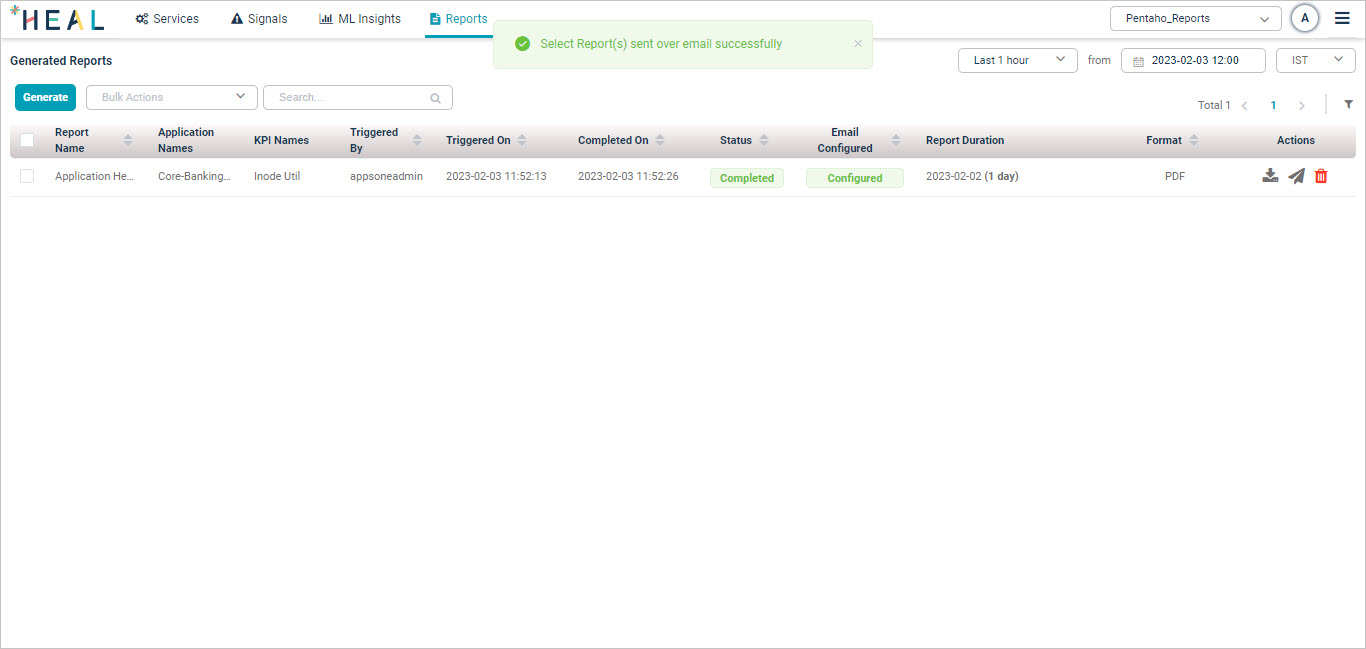
Resend a report by email
1. Click the resend icon ![]() on the Generated Reports page.
on the Generated Reports page.

2. Enter the email addresses in the Email Address(es) box (comma-separated for multiple recipients) and click Send.
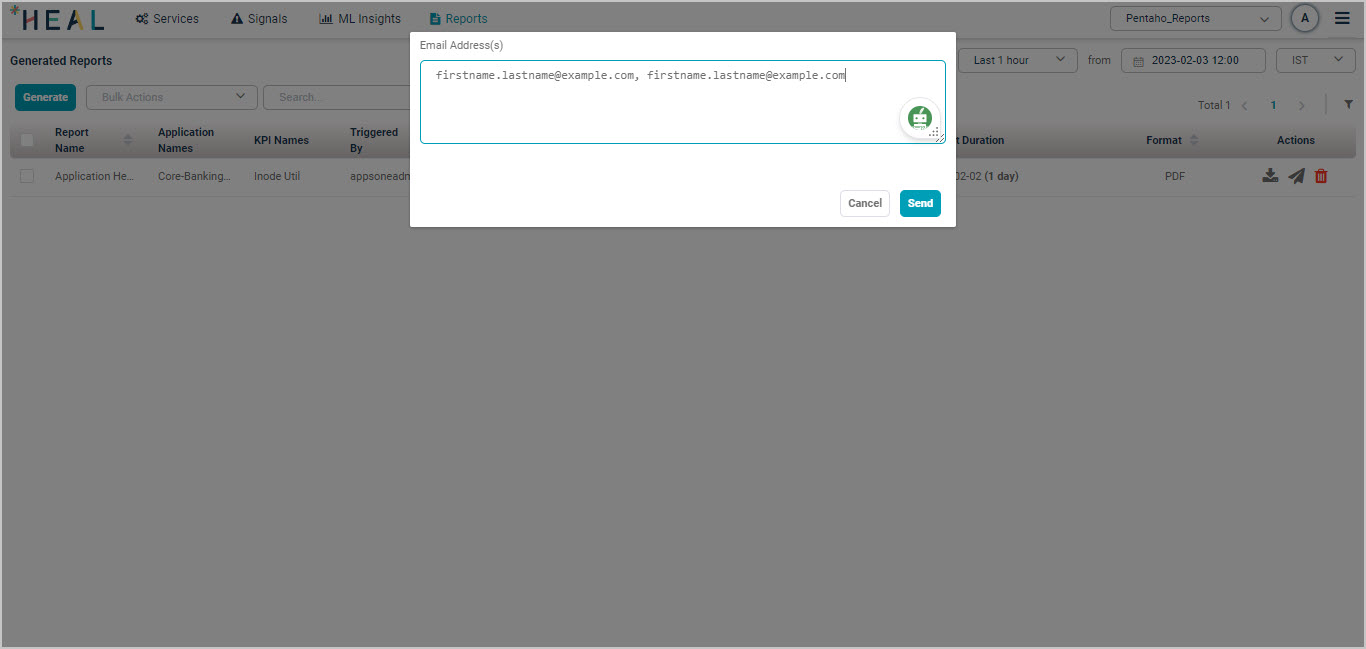
3. Confirmation. The message “Select Report(s) sent over email successfully” appears.
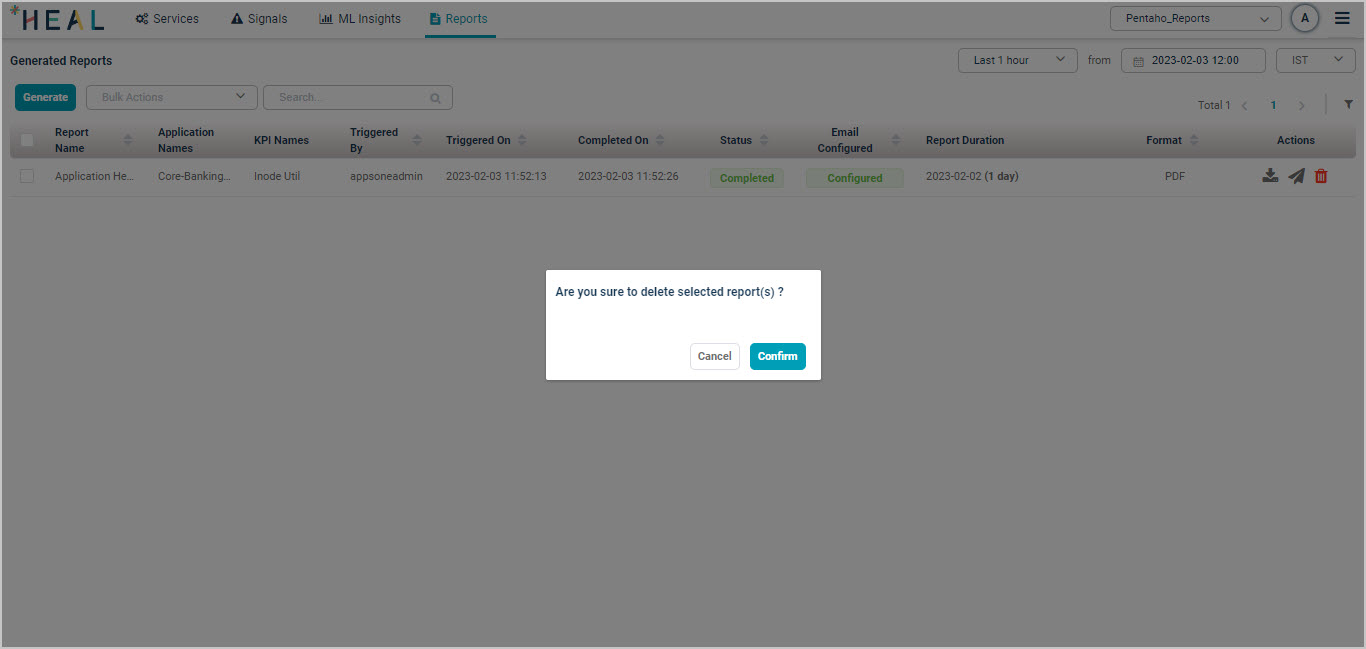
Delete a report
1. Click the delete icon in the Actions column on the Generated Reports page.

2. Confirm deletion. Click Confirm to delete or Cancel to keep the report.
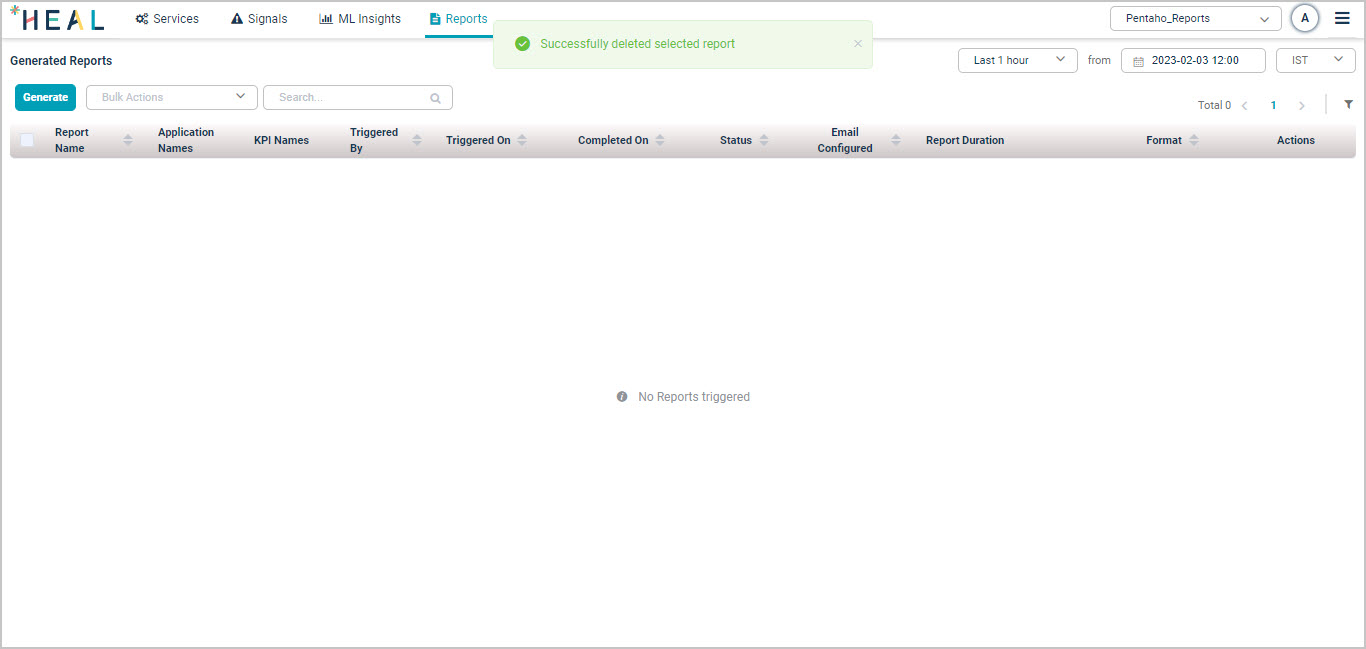
3. Confirmation. The message “Successfully deleted selected report” appears.
Report types
The first six reports below can be generated for the current day. The remaining reports become available after the day is complete.
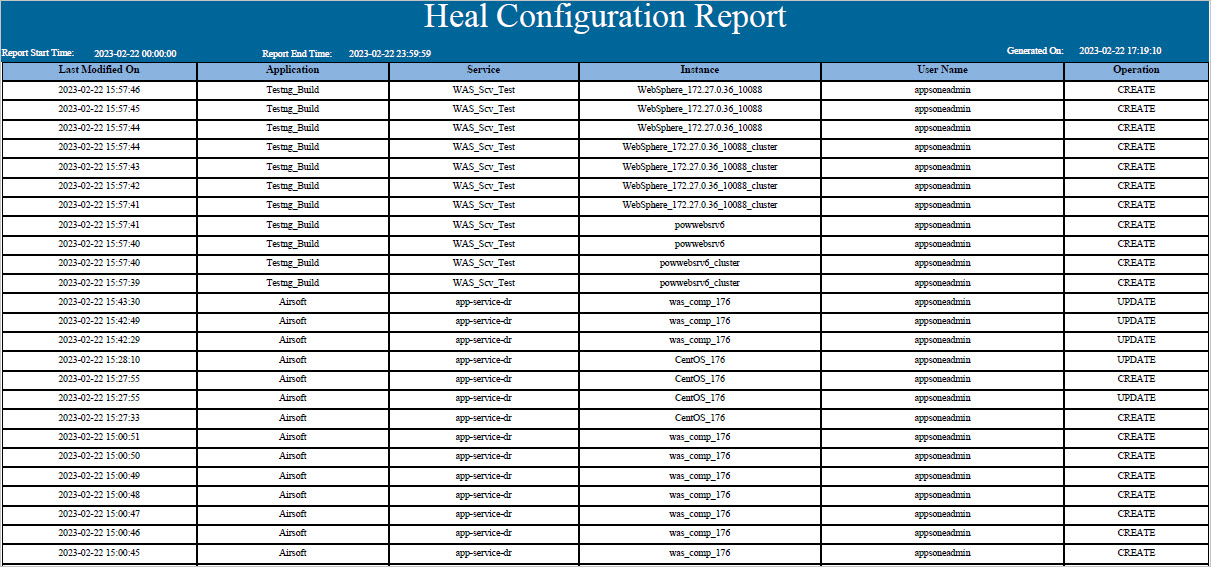
HEAL Configuration
Tracks configuration changes the user has made. Shows instance and service-level status of completed operations.
- Last Modified On. Date and time of the modification.
- Application. Linked application.
- Service. Linked service.
- Instance. Instance name. Shows NA when the change was made at service level.
- User Name. Who performed the change.
- Operation. CREATE, UPDATE, or DELETE.
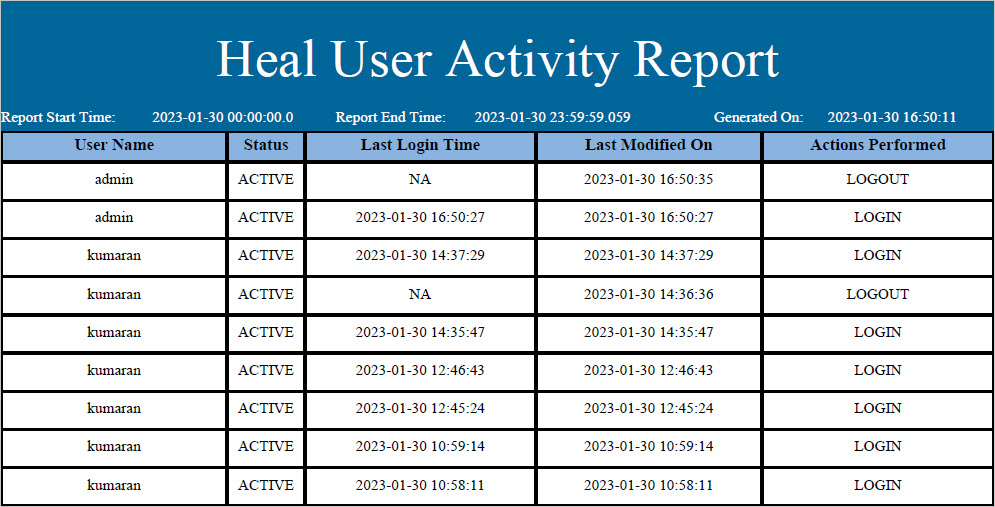
HEAL User Activity
Login, logout, and password changes by users (excluding appsoneadmin).
- User Name. Who performed the activity.
- Status. Active or inactive.
- Last Login Time. Most recent login timestamp.
- Last Modified On. When the user record was last updated.
- Actions Performed. Login or logout.
HEAL User Activity report with User IP
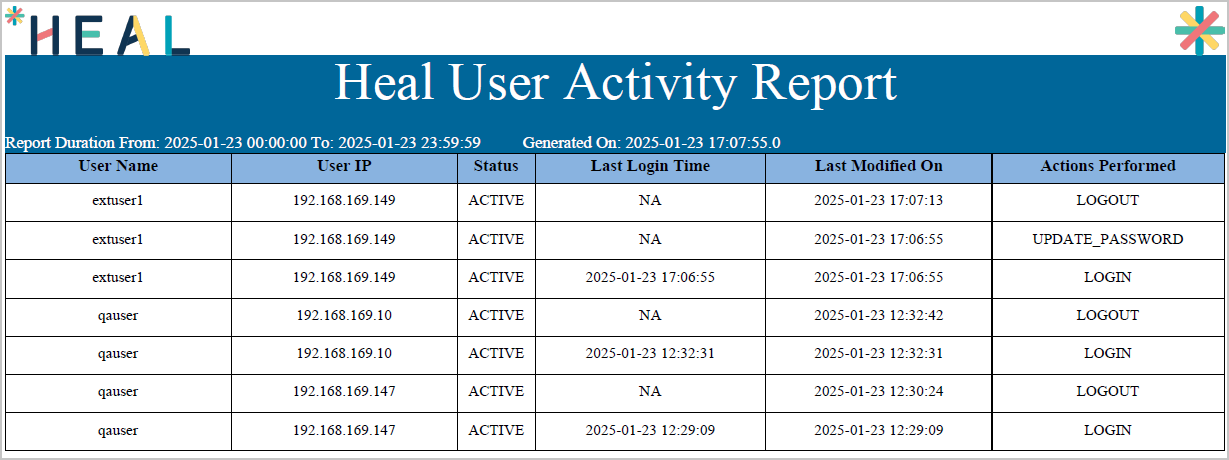
To enable the User IP column, see the HEAL User Activity Report guide.
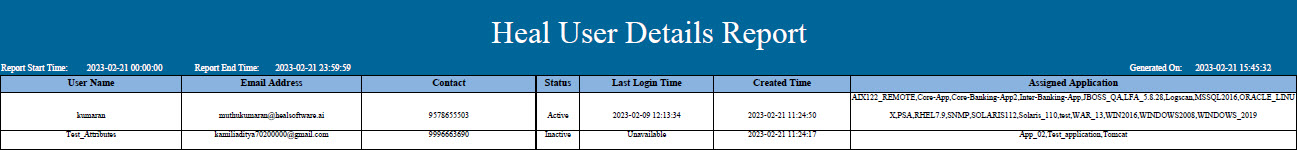
HEAL User Details
- User Name. Who is performing the activity.
- Email Address. Registered email.
- Contact. Phone or contact details.
- Status. Active or inactive.
- Last Login Time. Most recent login.
- Created Time. When the account was created.
- Assigned Application. Applications the user has access to.
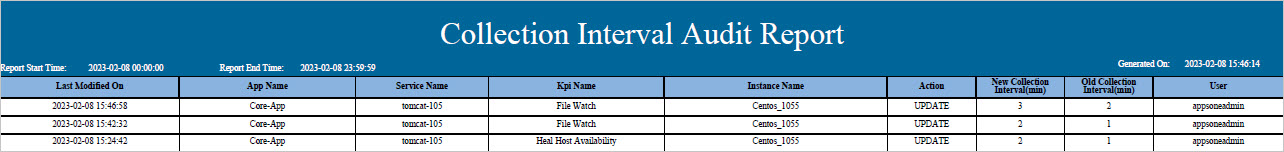
Collection Interval Audit
Tracks changes to the KPI collection interval at the instance level.
- Last Modified On. When the interval was changed.
- App Name, Service Name, Instance Name. Where the KPI is monitored.
- KPI Name. Affected KPIs.
- Action. Type of operation, e.g. update.
- New Collection Interval (min) / Old Collection Interval (min). Before and after values.
- User. Who made the change.
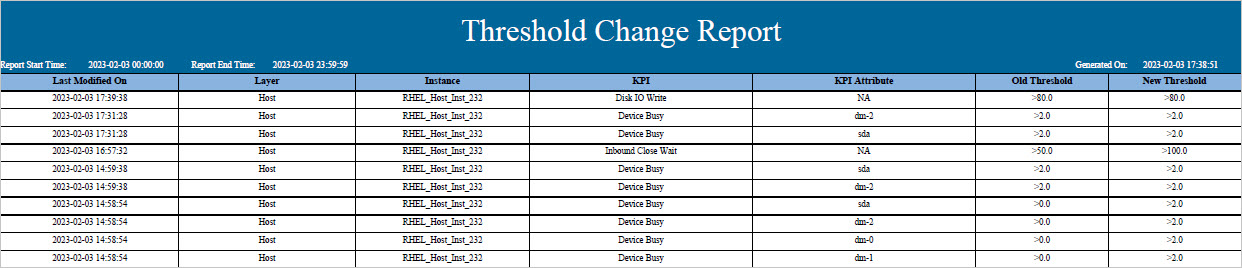
Threshold Change
Tracks changes to KPI thresholds at the instance level.
- Last Modified On. When the threshold was changed.
- Layer, Instance. Where the KPI lives.
- KPI / KPI Attribute. Which KPI and which sub-attribute.
- Old Threshold / New Threshold. Before and after values.
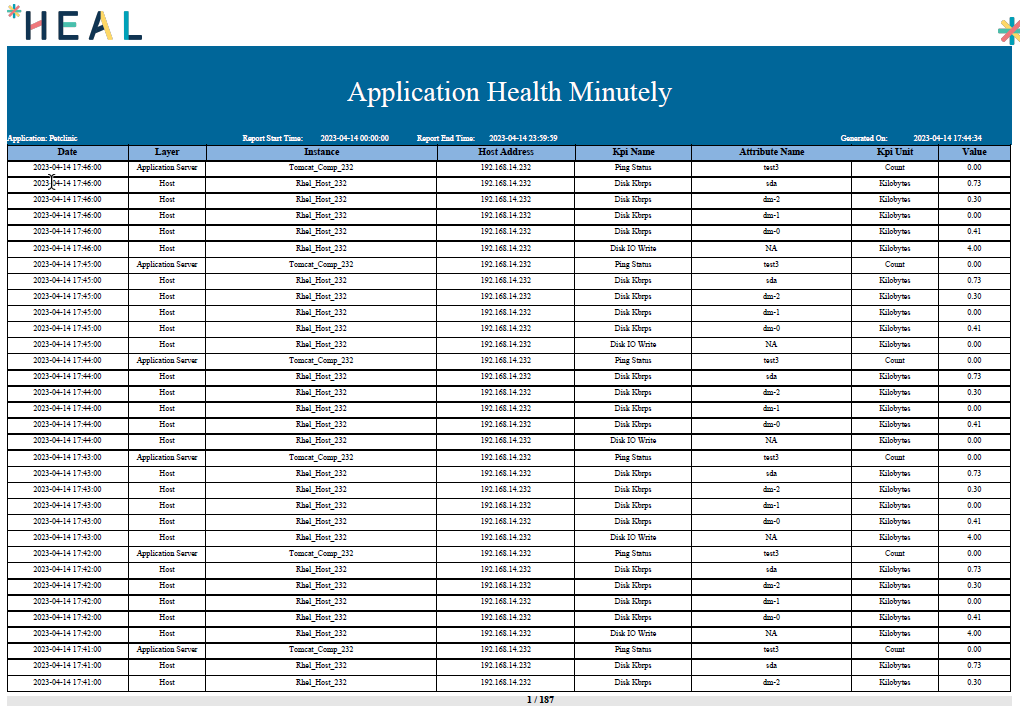
Application Health Minutely
Minute-level data for selected KPIs at the instance level (excluding ConfigWatch and FileWatch).
- Date. Timestamp of the data point.
- Layer, Instance, Host Address. Where the metric came from.
- KPI Name, Attribute Name, KPI Unit, Value. Metric details.
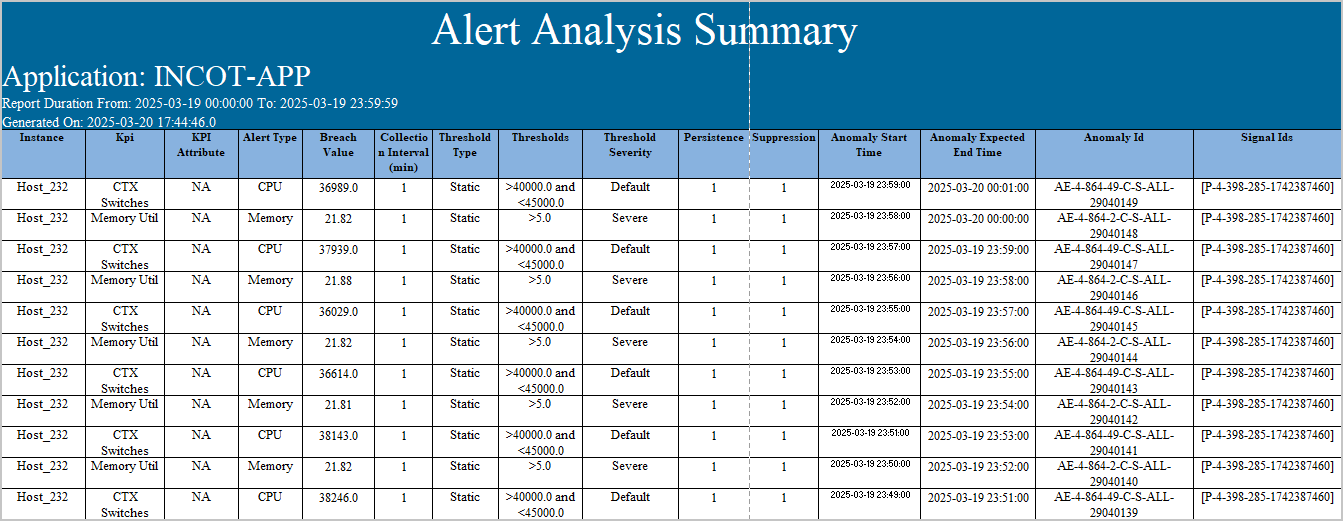
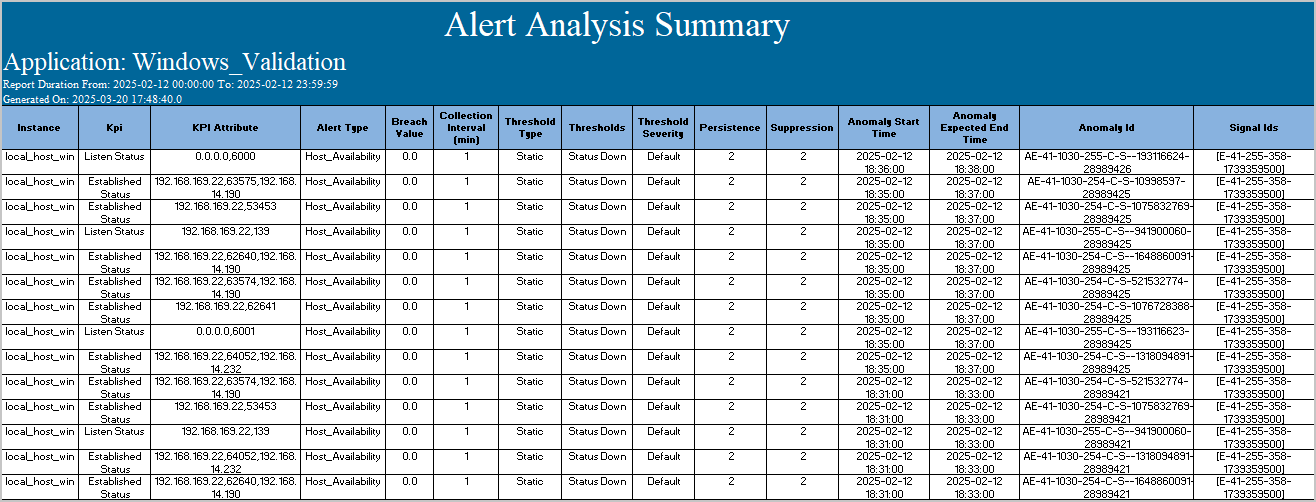
Alert Analysis Summary
Instance-level data for a given KPI at the time an event was raised.
- Instance, KPI, KPI Attribute. What was affected.
- Alert Type, Breach Value. The kind of alert and the value that crossed the threshold.
- Collection Interval (min). How often the KPI is collected.
- Threshold Type, Thresholds, Threshold Severity. Static or dynamic, the configured limits, and the severity flavor.
- Persistence, Suppression. How long the condition lasted and whether suppression rules applied.
- Anomaly Start Time, Anomaly Expected End Time. When the alert started and when it was expected to end.
- Anomaly Id, Signal Ids. Identifiers for the anomaly and any linked signals.
Core KPIs:
Availability KPIs:
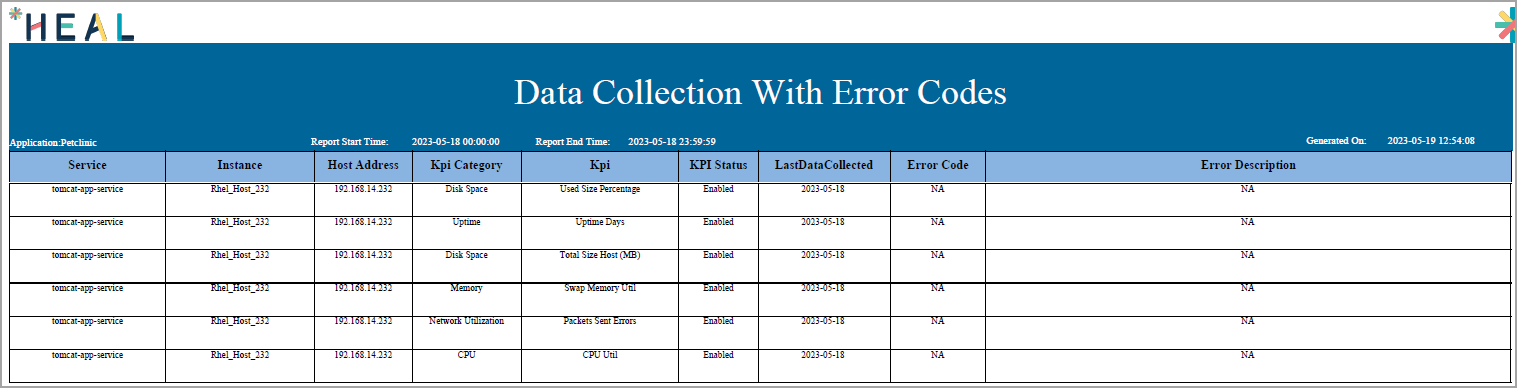
Data Collection With Error Codes
Lists selected KPIs mapped to the application. If an error code is available for a KPI without data collection, it appears with a description.
- Service, Instance, Host Address. Where data is collected from.
- KPI Category, KPI. Grouping and the specific metric.
- KPI Status. Enabled or disabled.
- LastDataCollected. Most recent successful collection date.
- Error Code, Error Description. Any error encountered.
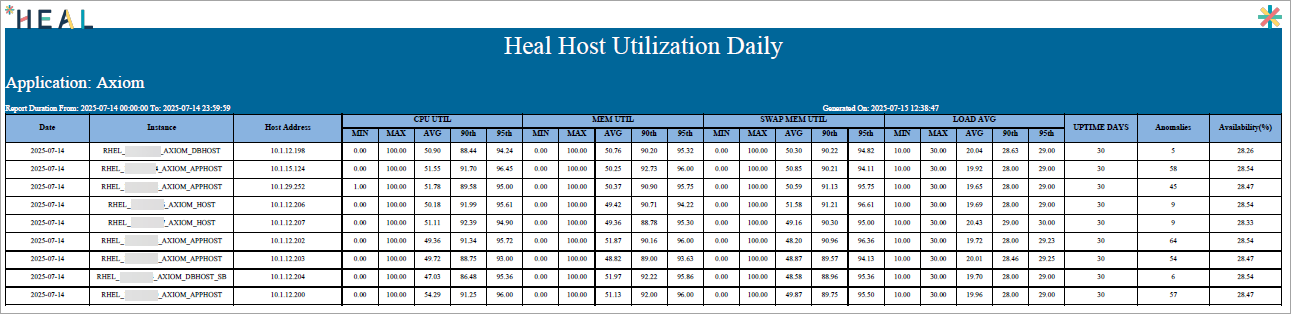
HEAL Host Utilization Daily
Daily host utilization KPIs.
- Date, Instance, Host Address. When and where.
- CPU Util, MEM Util, SWAP MEM Util, Load Avg. Each reported as MIN, MAX, AVG, 90th, and 95th percentile.
- Uptime Days. Continuous uptime.
- Anomalies. Count of anomaly events.
- Availability (%). Server host data point availability.
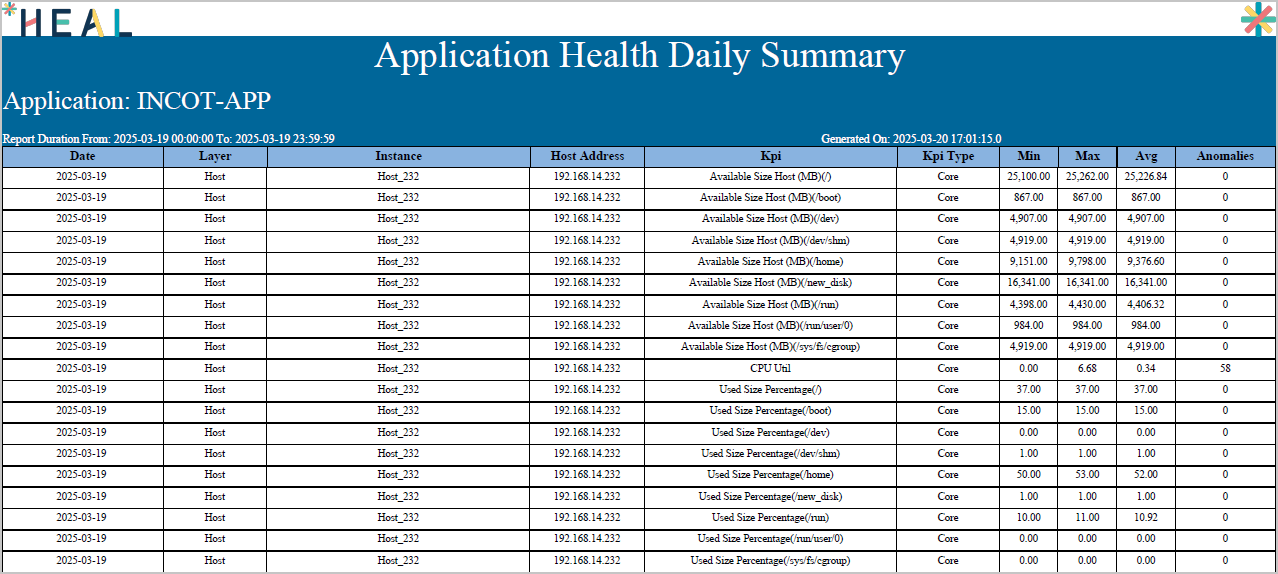
Application Health Daily Summary
Daily summary of selected KPIs at the instance level (excluding ConfigWatch and FileWatch).
- Date, Layer, Instance, Host Address. When and where.
- KPI, KPI Type. Metric and its category.
- Min, Max, Avg. Statistical summary for the day.
- Anomalies. Count of anomaly events.
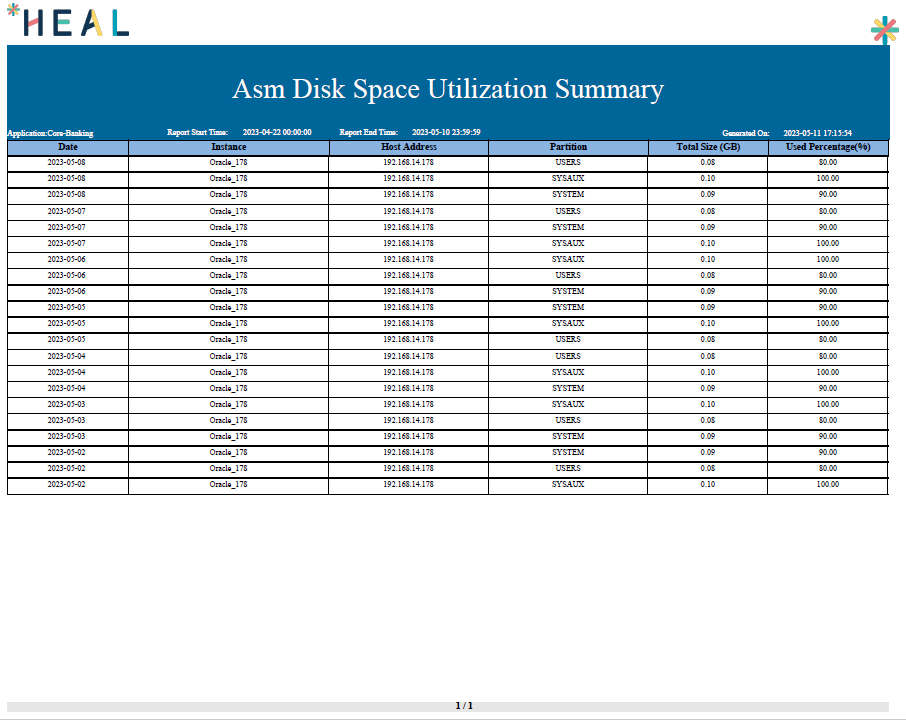
ASM Diskspace Utilisation Summary
Latest ASM disk-space data at the instance and attribute level (ASM Used Percentage and ASM Total Size).
- Date, Instance, Host Address. When and where.
- Partition. ASM disk group name (for example, USERS, SYSTEM).
- Total Size (GB), Used Percentage (%). Allocation and usage.
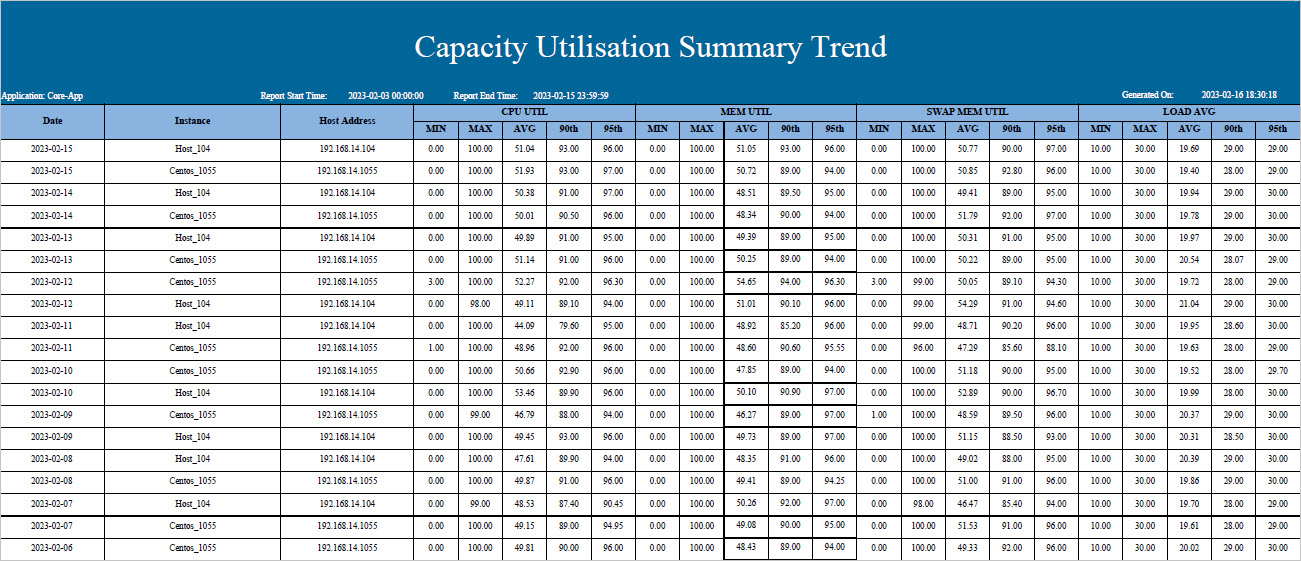
Capacity Utilisation Summary Trend
Daily capacity utilization for CPU, memory, swap memory, and load average. Each reported as Min, Max, Avg, 90th, and 95th percentile.
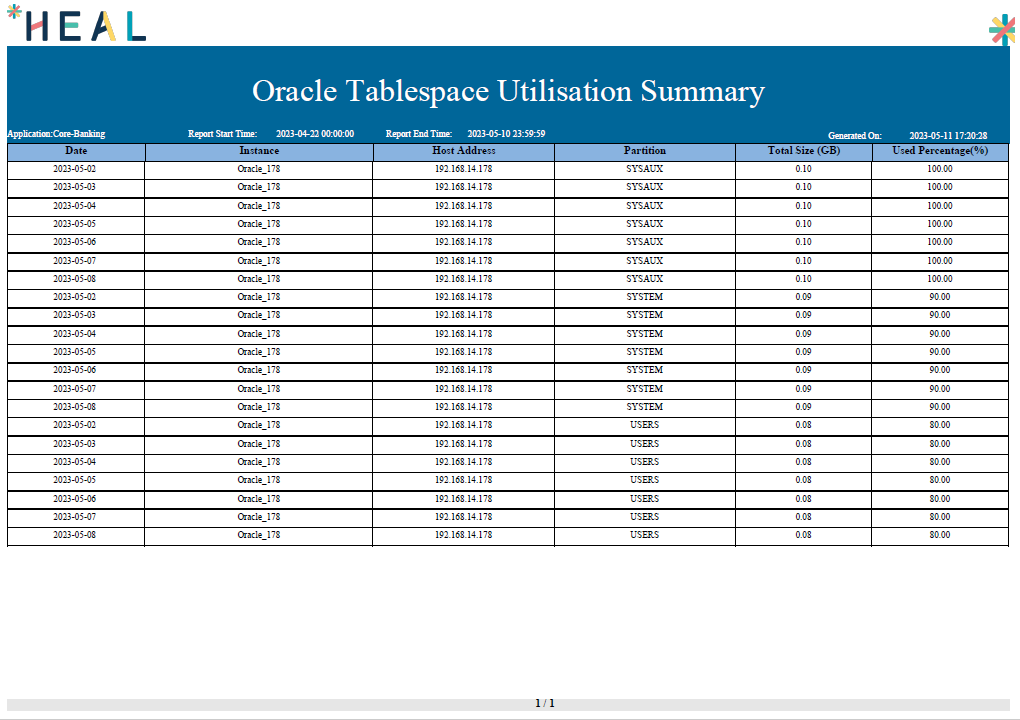
Oracle Tablespace Utilisation Summary
Latest Oracle tablespace data at the instance and attribute level.
- Date, Instance, Host Address. When and where.
- Partition. Tablespace name (for example, SYSAUX, SYSTEM, USERS).
- Total Size (GB), Used Percentage (%). Allocation and usage.
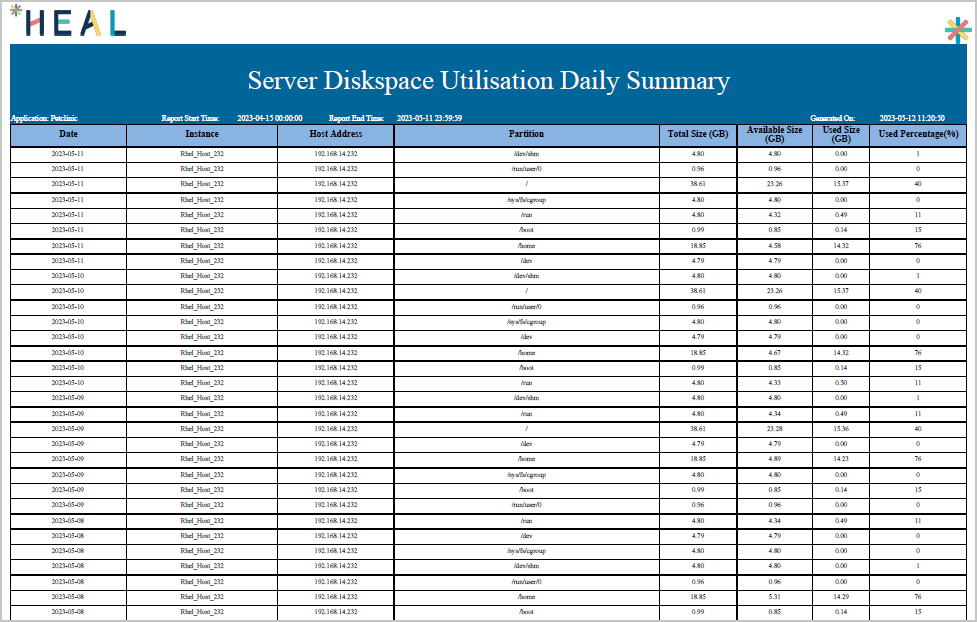
Server Diskspace Utilisation Daily Summary
Latest server disk-space data at the attribute level.
- Date, Instance, Host Address. When and where.
- Partition. Disk partition or mount point (for example, /, /home, /run).
- Total Size (GB), Available Size (GB), Used Size (GB), Used Percentage (%). Capacity and usage.
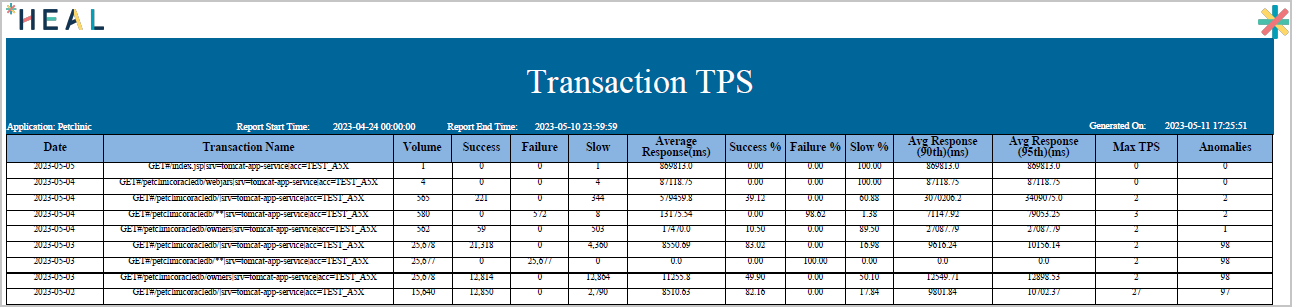
Transaction TPS
Per-transaction performance summary.
- Date, Transaction Name. When and which transaction.
- Volume, Success, Failure, Slow. Counts.
- Average Response (ms), Avg Response (90th), Avg Response (95th). Response time stats.
- Success %, Failure %, Slow %. Percentages.
- Max TPS. Peak transactions per second.
- Anomalies. Count of anomaly events.
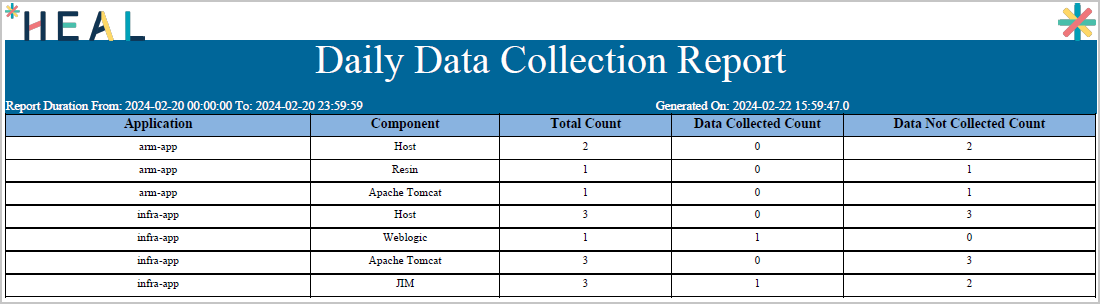
Daily Data Collection Report
Host, component, and JIM instance data availability for the last N days (N follows OpenSearch ISM policies).
- Application, Component. Tracked application and component (for example, Host, Tomcat, WebLogic).
- Total Count. Expected data collection points.
- Data Collected Count, Data Not Collected Count. What was and was not collected.
For JIM: Total count covers all JIM instances. Instances with available transaction data in OpenSearch for the day count toward Data Collected.
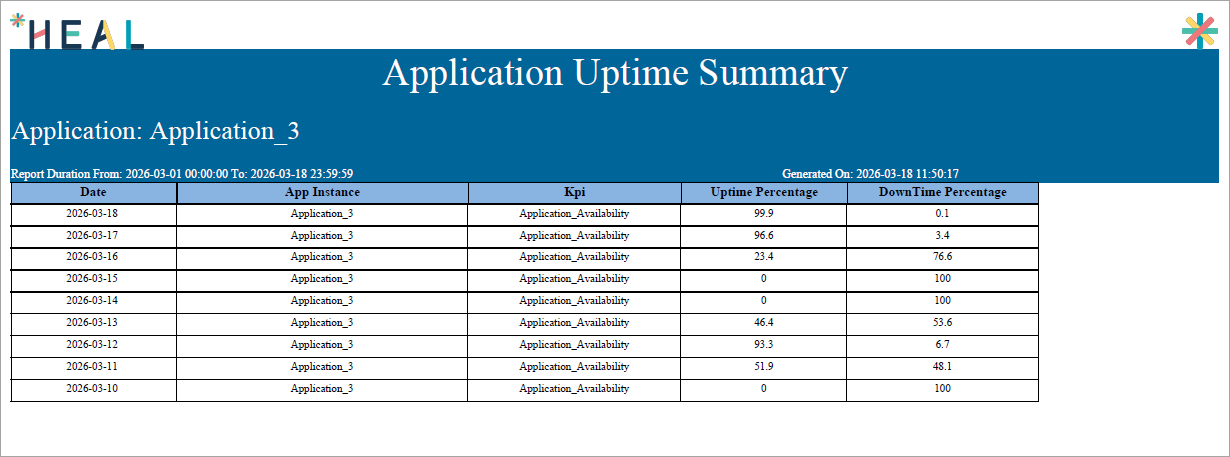
Application Uptime Summary
Application availability and uptime over a daily, weekly, or monthly time range. Calculated from minute-level evaluation of application health using configured instance KPIs.
- Date. Day covered.
- App Instance. The instance being monitored.
- KPI. The KPI used (for example, application availability).
- Uptime Percentage, DownTime Percentage. Availability split.
Next
- Viewing MLE Insights Dashboard . AI-driven view of your most important metrics.
- Navigating Signal Tab . problems and early warnings.
- Application Summary . application-level drill-down.