How Can We Help?
Search for answers or browse our knowledge base.


ML Insights inside an Early Warning or Problem report shows the top ten most important metrics for the services on the timeline.
View ML Insights
In the Early Warning or Problem report, click ML Insights. HEAL lists the top ten metrics tied to the services in the timeline.
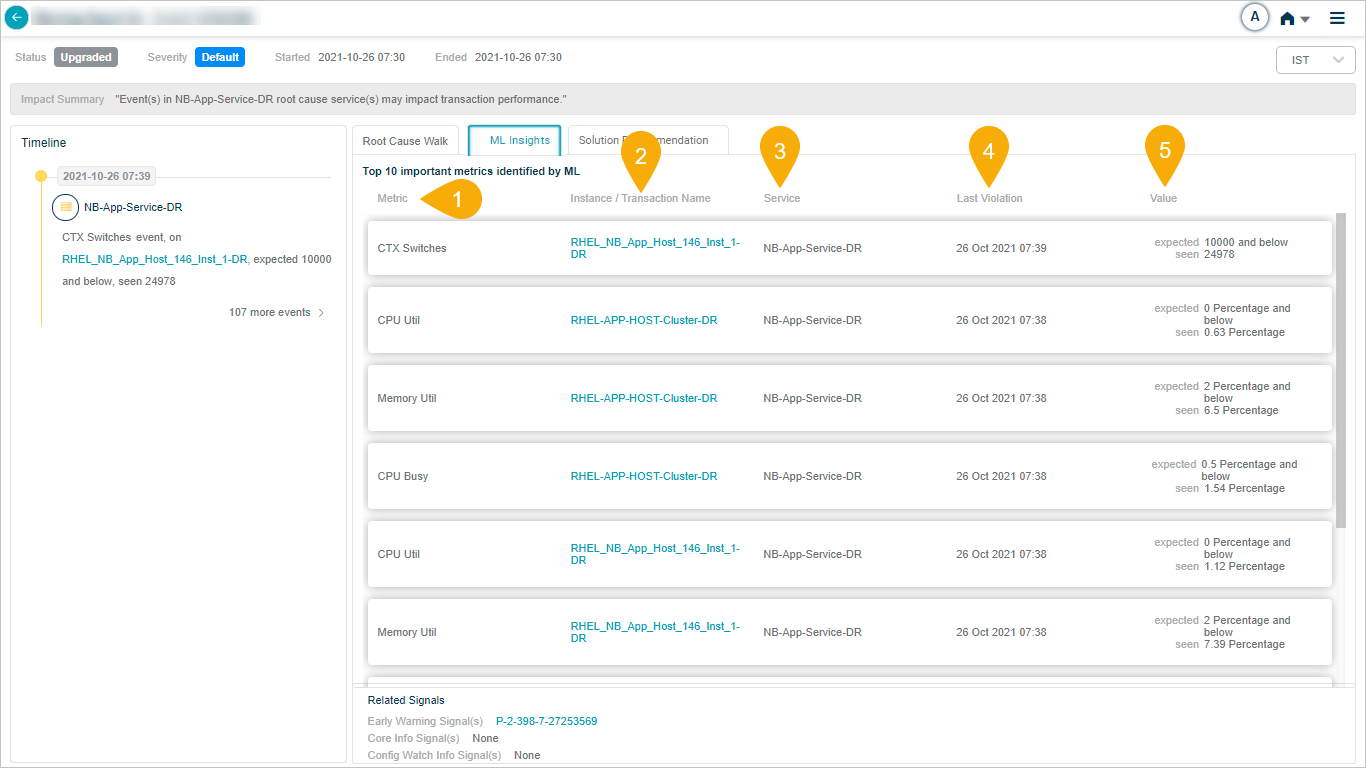
What’s on the screen
1. Metric. Name of the key performance metric.
2. Instance / Transaction Name. The instance or transaction the metric belongs to.
3. Service. The service the metric belongs to.
4. Last Violation. When the most recent violation happened.
5. Value. Actual and expected values at the time of the last violation.
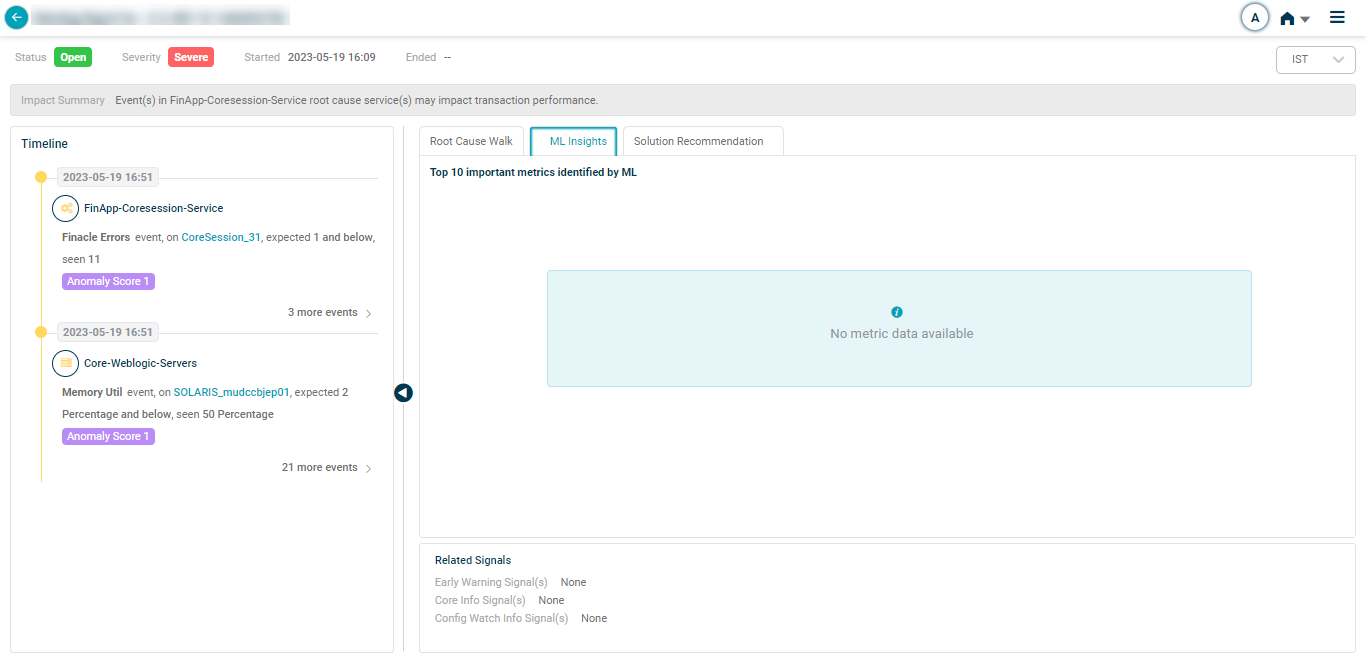
No significant metrics
If no significant metrics are linked to the services on the timeline, HEAL shows this view.
Next
- Viewing MLE Insights Dashboard . the standalone ML Insights dashboard.
- Root Cause Analysis . trace the cause of a signal.
- View Solution Recommendation . suggested fixes.