Search for answers or browse our knowledge base.


The Signals tab shows every signal HEAL has raised in one place. Filter, sort, and download the list to see what is affecting your applications and services.
What you can do here
- See every Problem, Early Warning, and Info Signal.
- Read each signal’s type, severity, status, and description.
- See the affected applications and services.
- Filter by timestamp, type, severity, or status.
- Download the list as CSV.
Open the Signals tab
Sign in to the HEAL UI and click the Signals tab. From the Signals List, switch between Lead Signals and Info Signals.
Lead Signals view
Pick Lead Signals to see all Problems and Early Warnings.
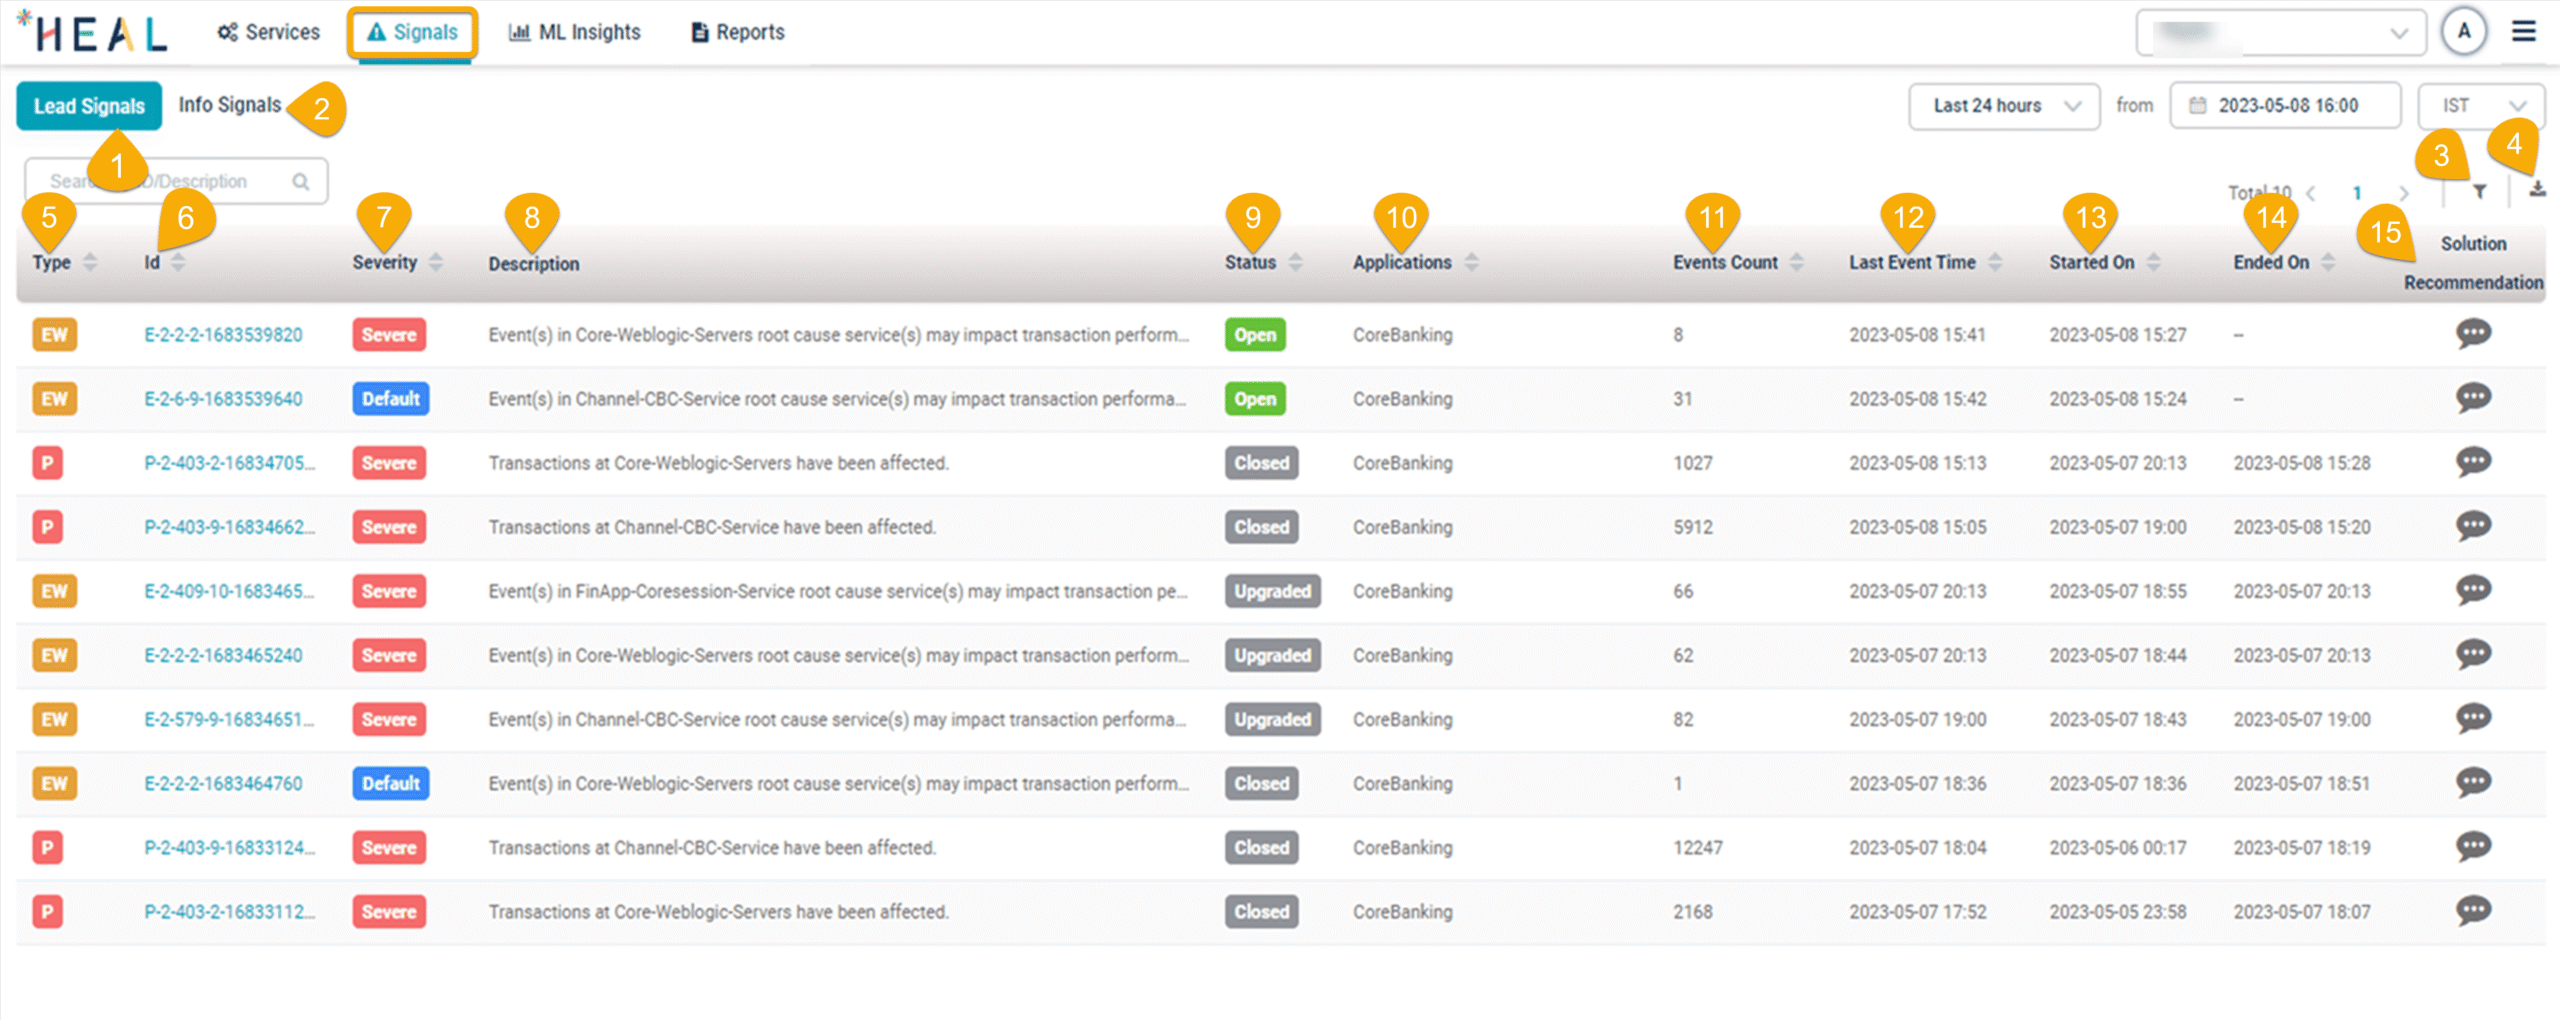
1. Lead Signals. Real-time Early Warnings and Problems on service behavior and transactions.
2. Info Signals. System changes that do not directly affect performance or availability.
3. Filter. Open the filter panel to narrow the list.
4. Download. Export the list as CSV.
5. Signal Type. P for Problem, EW for Early Warning.
6. Signal Id. Unique identifier for the signal.
7. Severity. Severe or Default.
8. Description. The signal description with the affected applications and services.
9. Status. Open, Closed, or Upgraded.
10. Affected Applications. The application the affected service belongs to, plus applications of any downstream services.
11. Events Count. Total events inside the signal.
12. Last Event Timestamp. When the most recent event occurred.
13. Signal Occurrence Timestamp. When the signal was first generated.
14. Signal Closure Timestamp. When the signal closed.
15. Solution Recommendation. Top three suggested solutions for the root cause. Click to read them and rate them. See View Solution Recommendation.
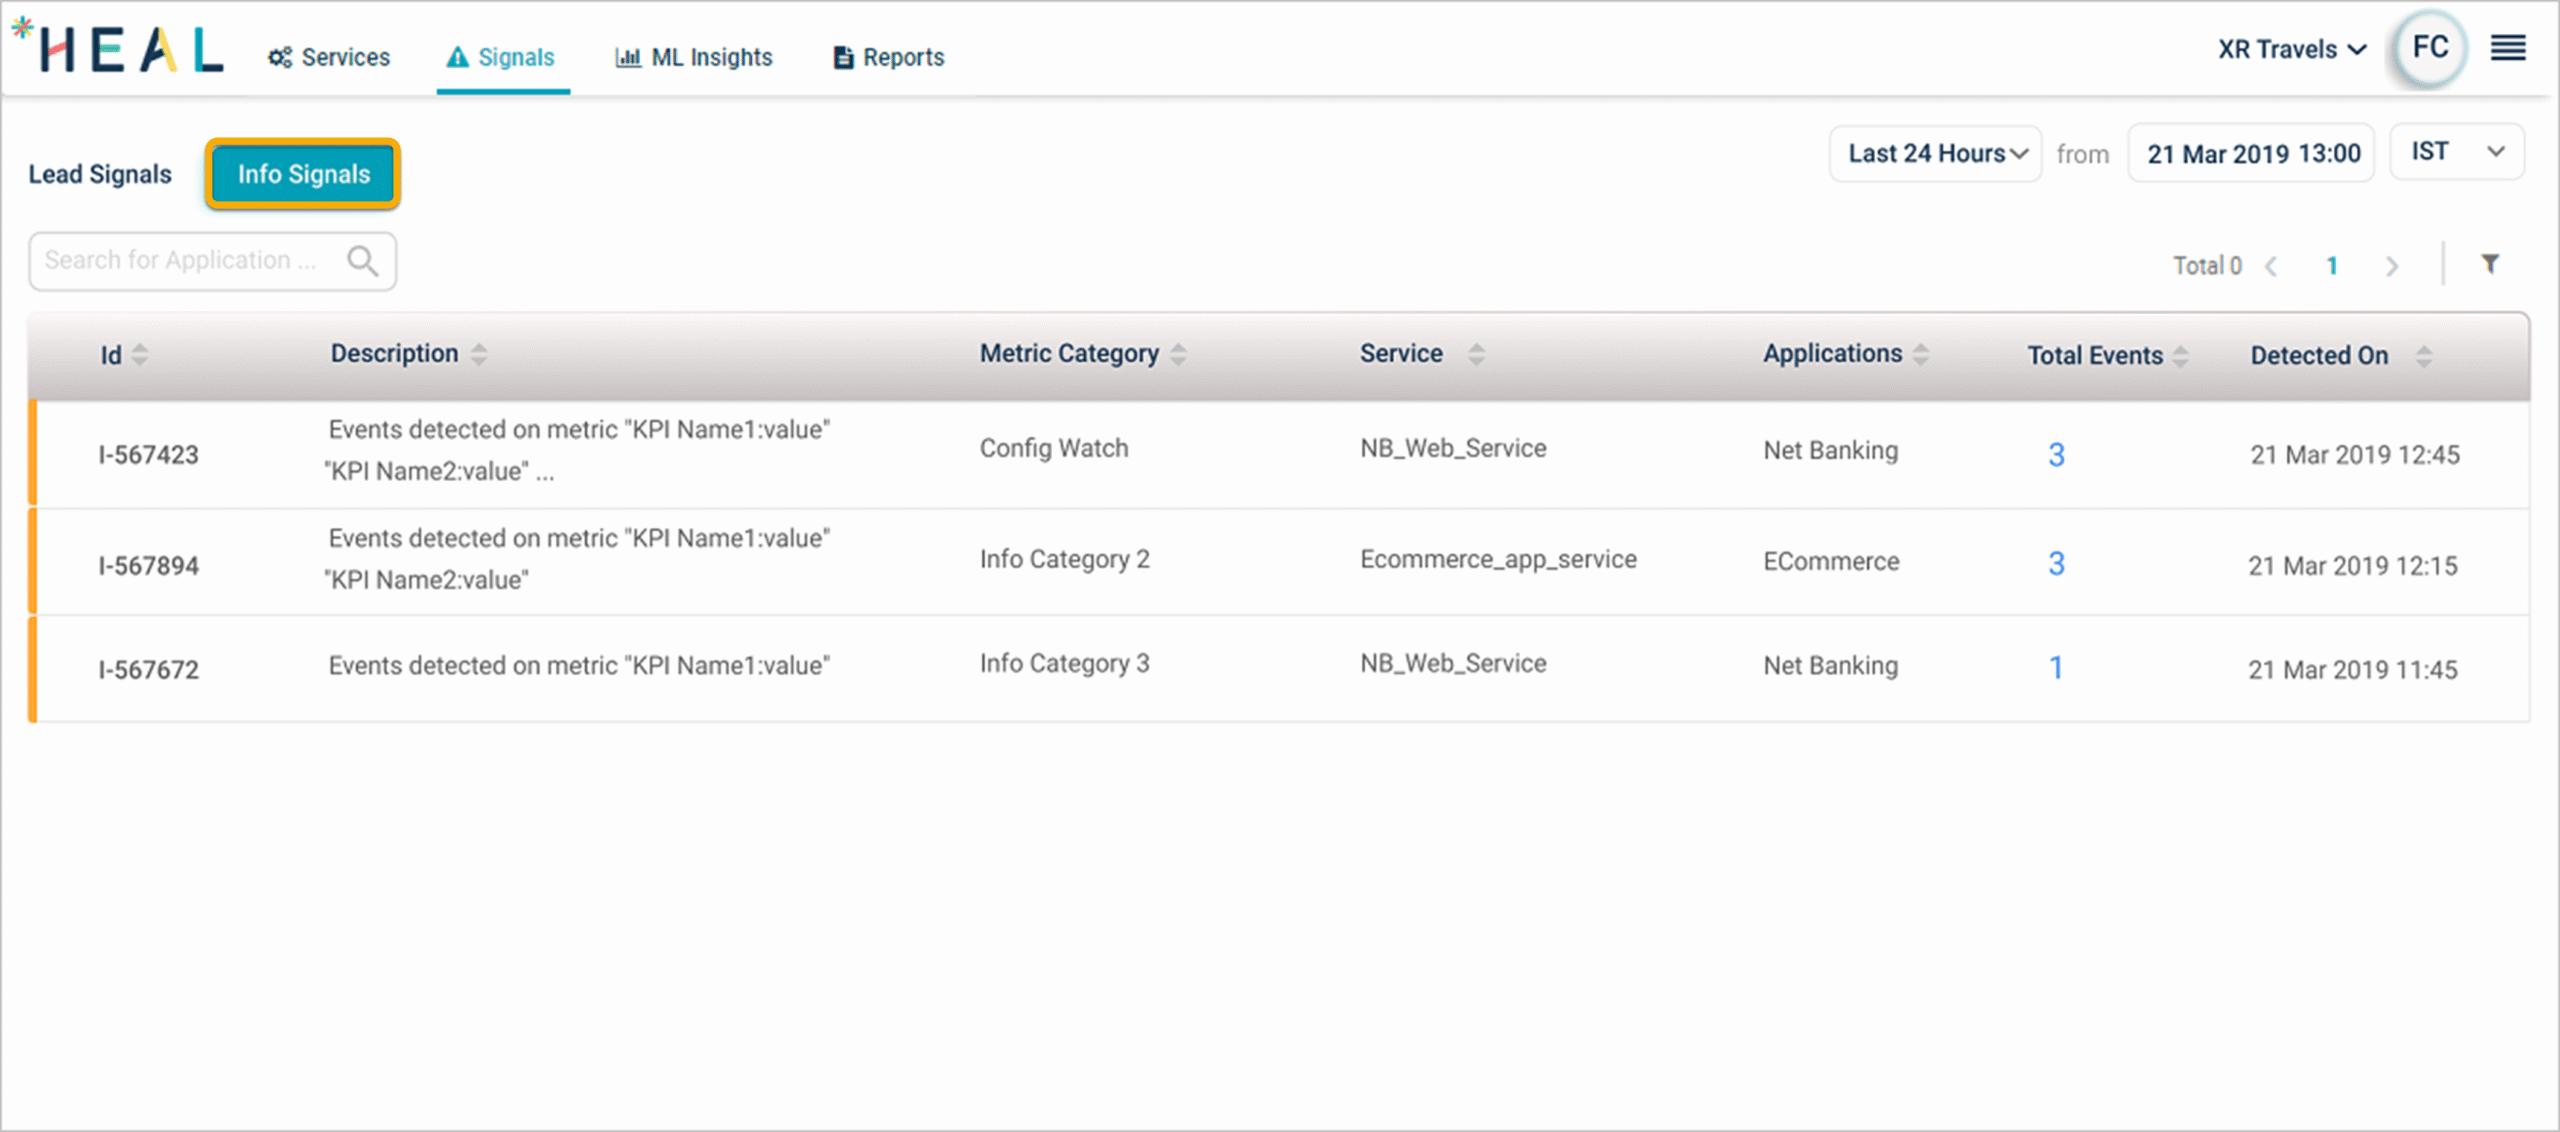
Info Signals view
Pick Info Signals to see informational notifications.
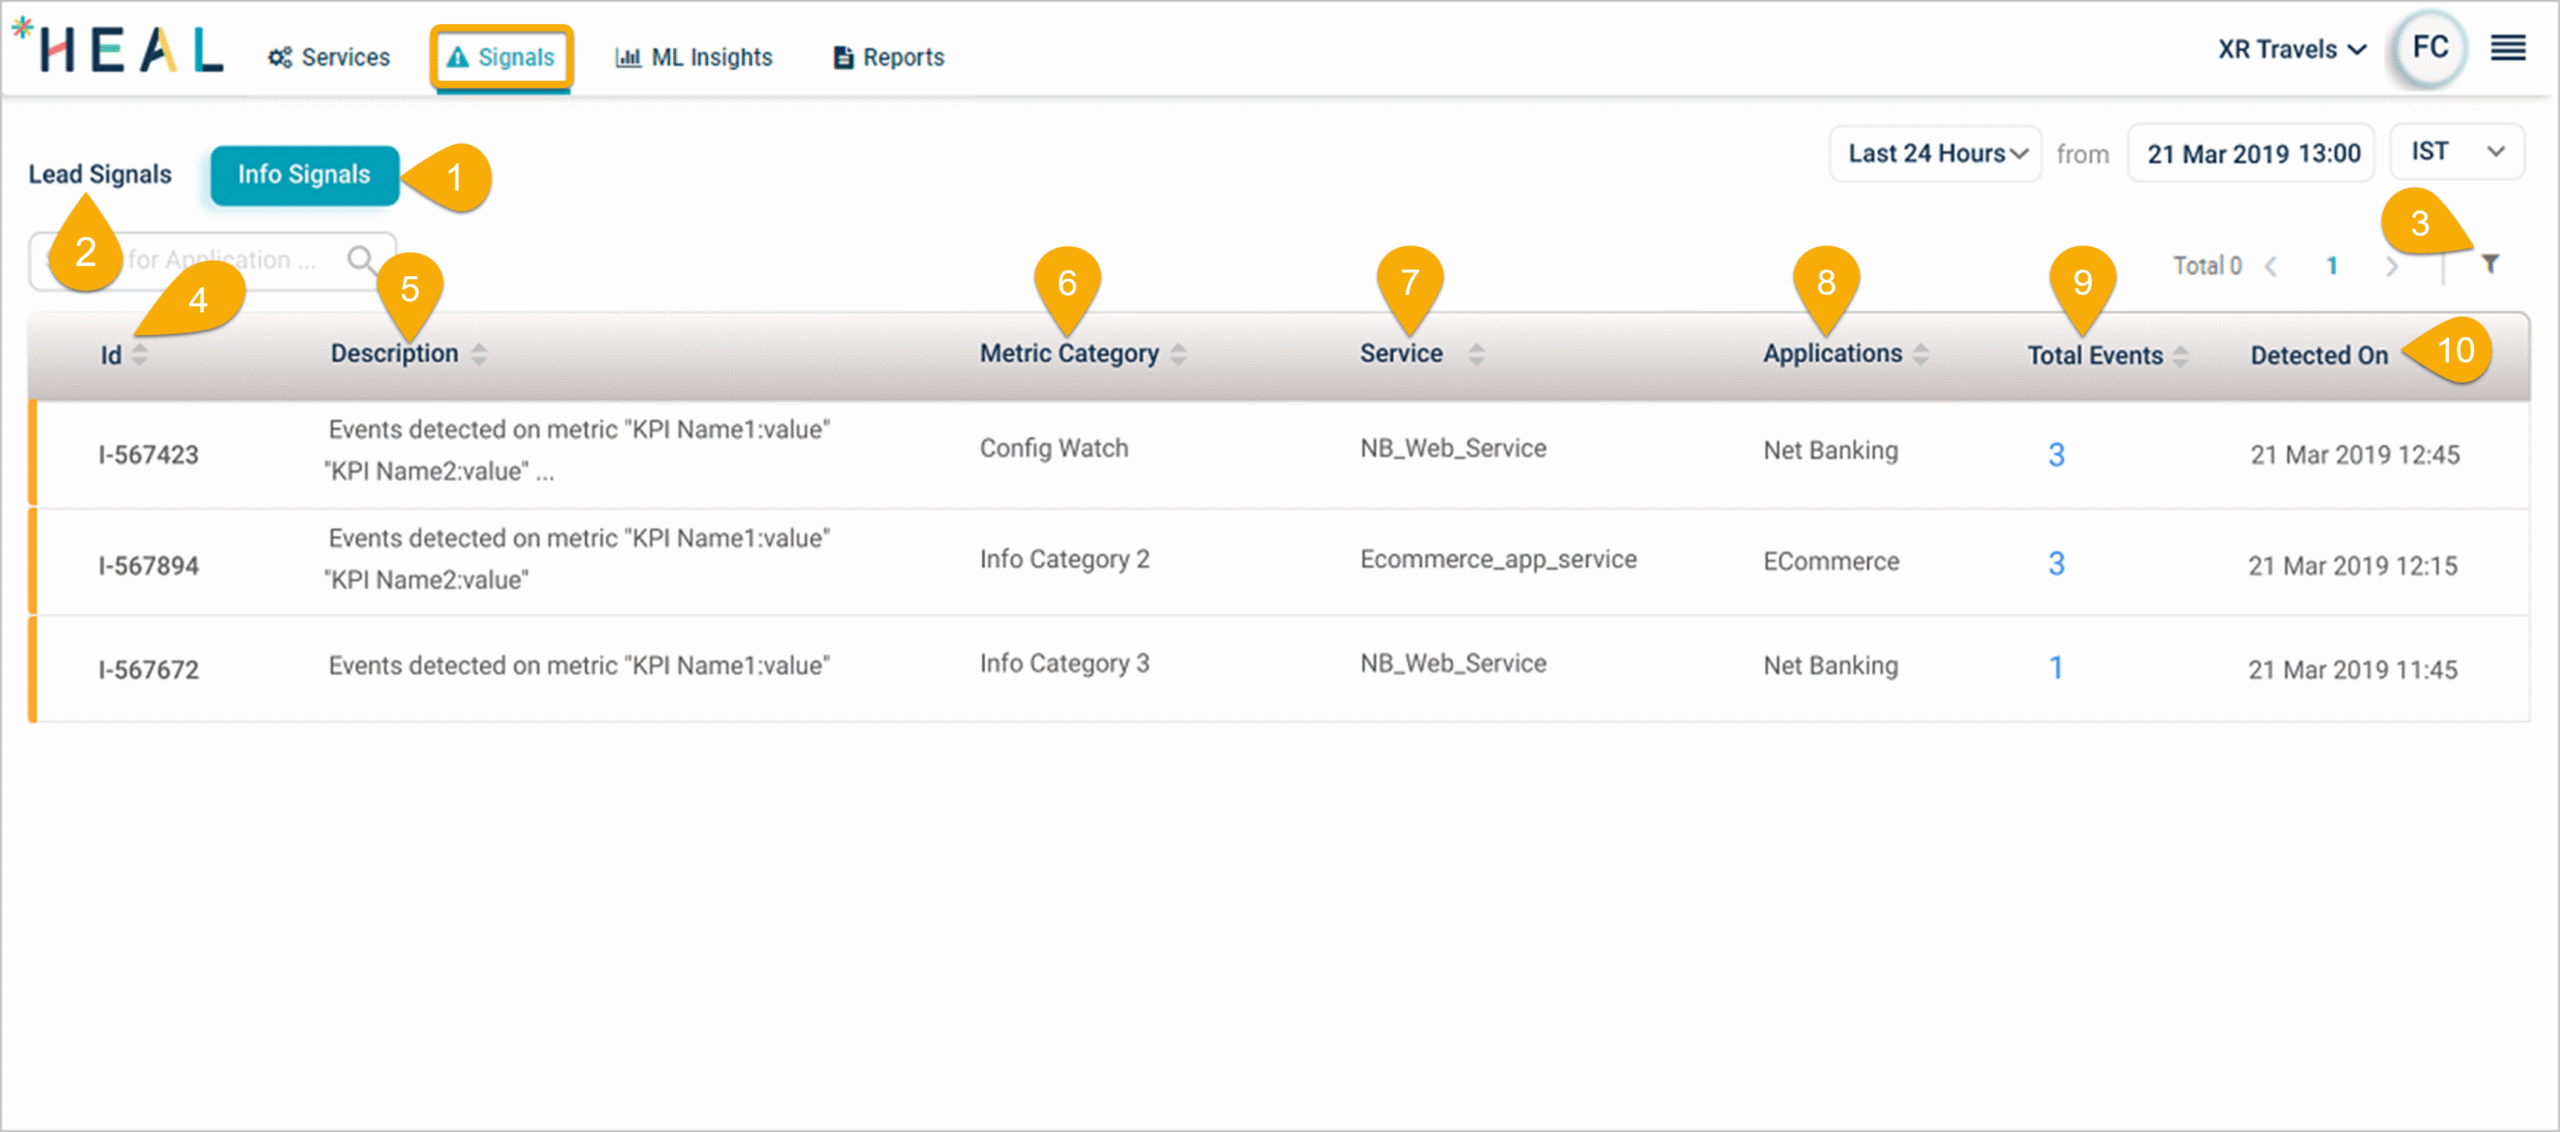
1. Info Signals. Notifications on system changes that do not directly affect performance or availability.
2. Lead Signals. Switch back to Problems and Early Warnings.
3. Filter. Open the filter panel.
4. Signal Id. Unique identifier for the signal.
5. Description. The signal description with affected applications and services.
6. Metric Category. Which performance or availability metric category the signal is tied to.
7. Service. The service affected by the signal.
8. Applications. Applications linked to the affected service and to any downstream services.
9. Total Events. Info events that make up the signal.
10. Detected On. When the signal was first detected.
Signal types
Lead Signals
Lead signals catch potential issues early. Two types:
Early Warning. Triggered when one or more services behave abnormally but transactions at entry-point services are still fine. Transaction or request volume breaches count as Early Warnings. The goal is to give you diagnostic data before a slowdown reaches end users. An Early Warning is severe if at least one of its anomalies is marked severe (admins set this in the Control Center).
Problem. Triggered when one or more services behave abnormally and transactions at entry-point services either fail or slow down (timed-out and unknown transactions count as failures). A Problem is a set of related incidents that may share a common cause or impact end users. Severe if at least one anomaly inside it is marked severe.
Info Signals
Info Signals are separate from Problems and Early Warnings. Info events do not show up in the timeline of a Problem or an Early Warning.
How they are generated. When HEAL raises an event on an Info KPI, that event becomes part of an Info Signal. Every user assigned to the application gets the notification. Info KPI changes are informational rather than performance-impacting.
Info metric categories. Set them up in the Control Center. Every metric in an Info category is an Info metric and feeds Info Signals. Other categories feed Lead Signals. Users can choose which Info alerts they want to receive.
Signal severity
Problem signals
Severe Problem. Transactions at entry-point services are failing. Events appear in Failed, Timed-Out, or Unknown transaction metrics.
Default Problem. Transactions at entry-point services are slowing down but failures are still inside normal limits.
Early Warning signals
Severe Early Warning. Same as Default, but at least one event inside is marked severe.
Default Early Warning. Related events affect one or more services in an application. None of them are marked severe.
Signal status
Problem status
Open. Set when the Problem is created.
Closed. Set when every transaction metric with events returns to normal.
Early Warning status
Open. Set when the Early Warning is created.
Closed. Set when the Early Warning is resolved before becoming a Problem.
Upgraded. Set when requests on an entry-level service in the path are affected, signaling a possible escalation to a Problem.
Filter signals
Filter Lead Signals
1. Click the filter icon in the Lead Signals section.
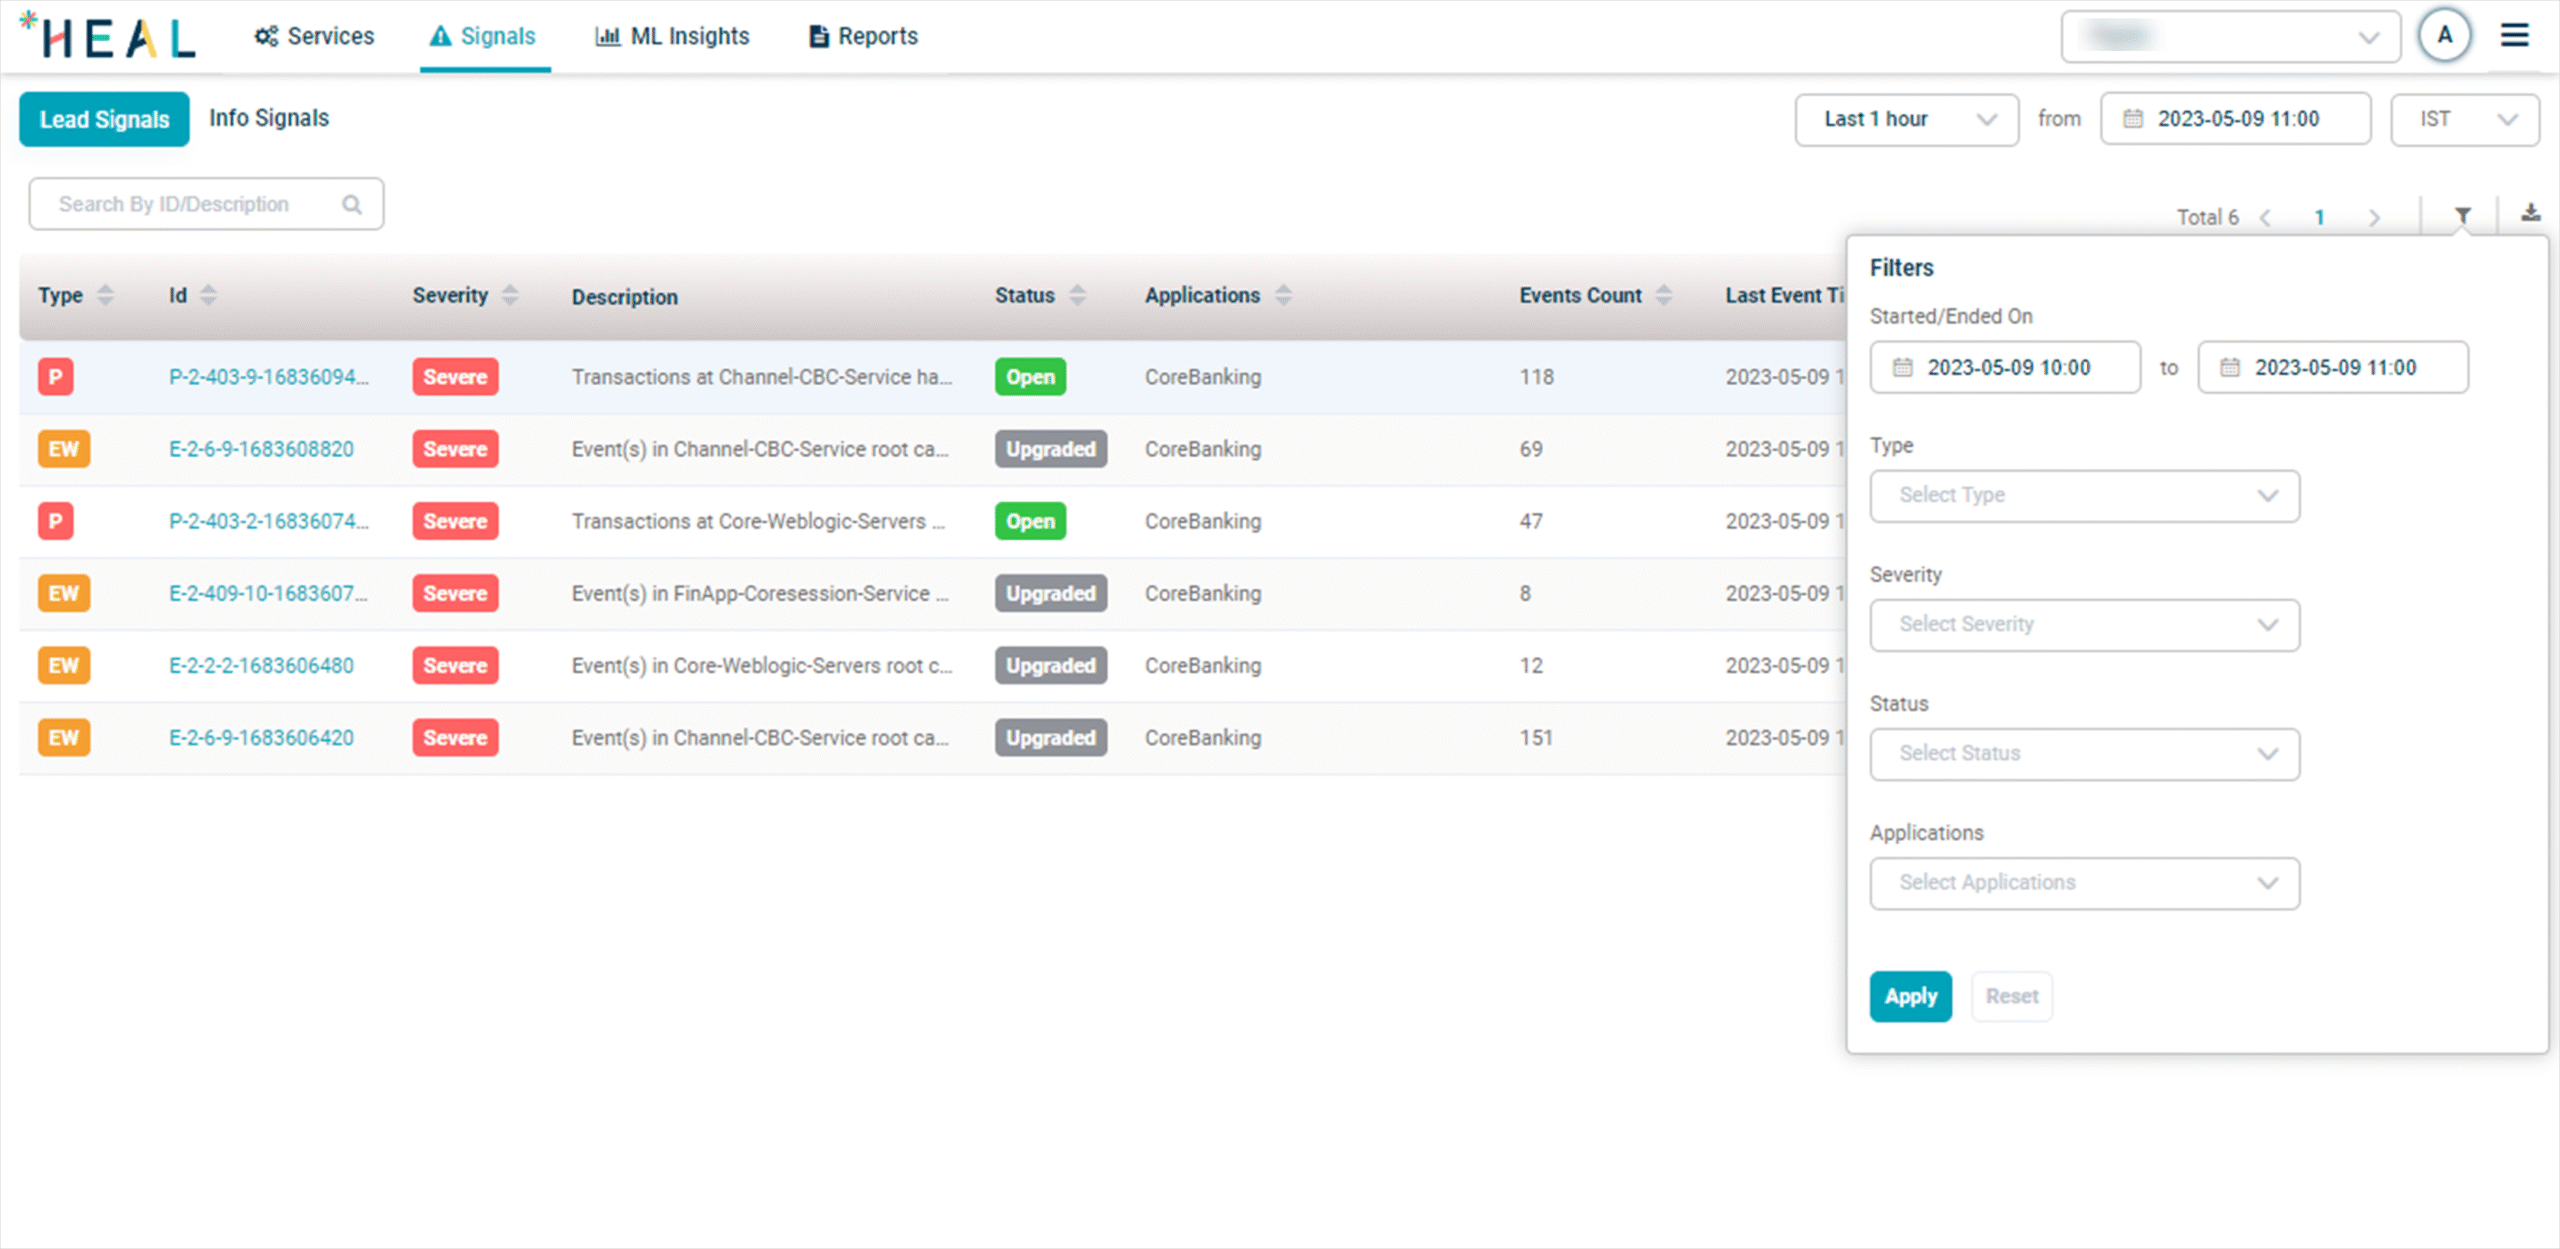
2. Fill in the filters and click Apply.
- Timestamp. Start and end date and time.
- Signal Type. Problem or Warning.
- Severity. Severe or Default.
- Status. Open, Closed, or Upgraded.
- Applications. One or more applications.
Filter Info Signals
1. Click the filter icon in the Info Signals section.
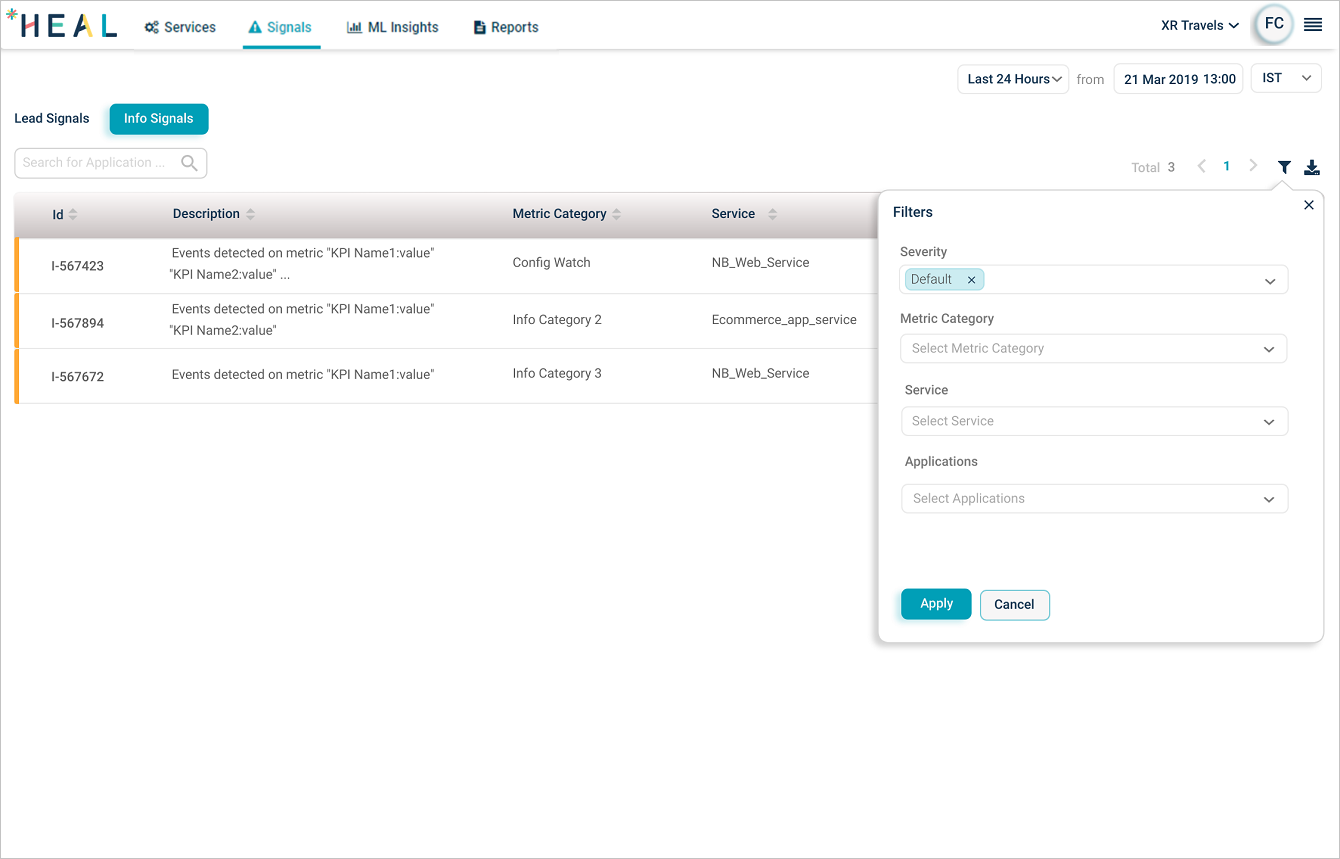
2. Fill in the filters and click Apply.
- Severity. Severe or Default.
- Metric Category. Specific performance or availability metric category.
- Service. One or more services.
- Applications. One or more applications.
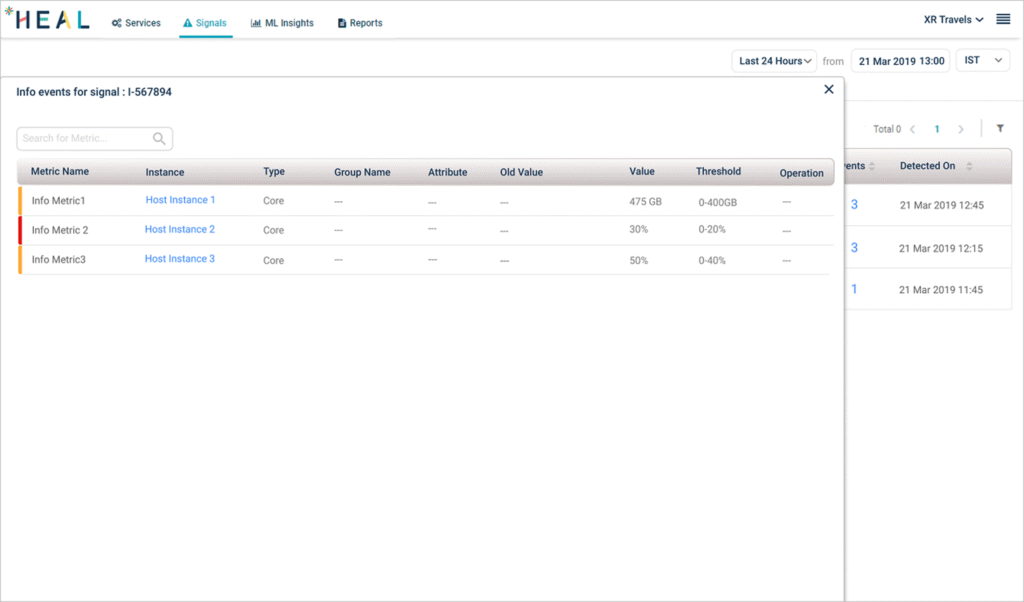
View Info Signals
1. Pick Info Signals from the Signals List.
2. Click the events count in any row to see the Info events for that signal. Click the instance name to open Service Details.
Solution Recommendation
When HEAL raises a Problem or Early Warning, it suggests the top three solutions for the root cause. The recommendations are based on historical tickets HEAL has organized into categories like disk issues or database out-of-memory errors.
Click the message icon in the Solution Recommendation column to open the recommendations.
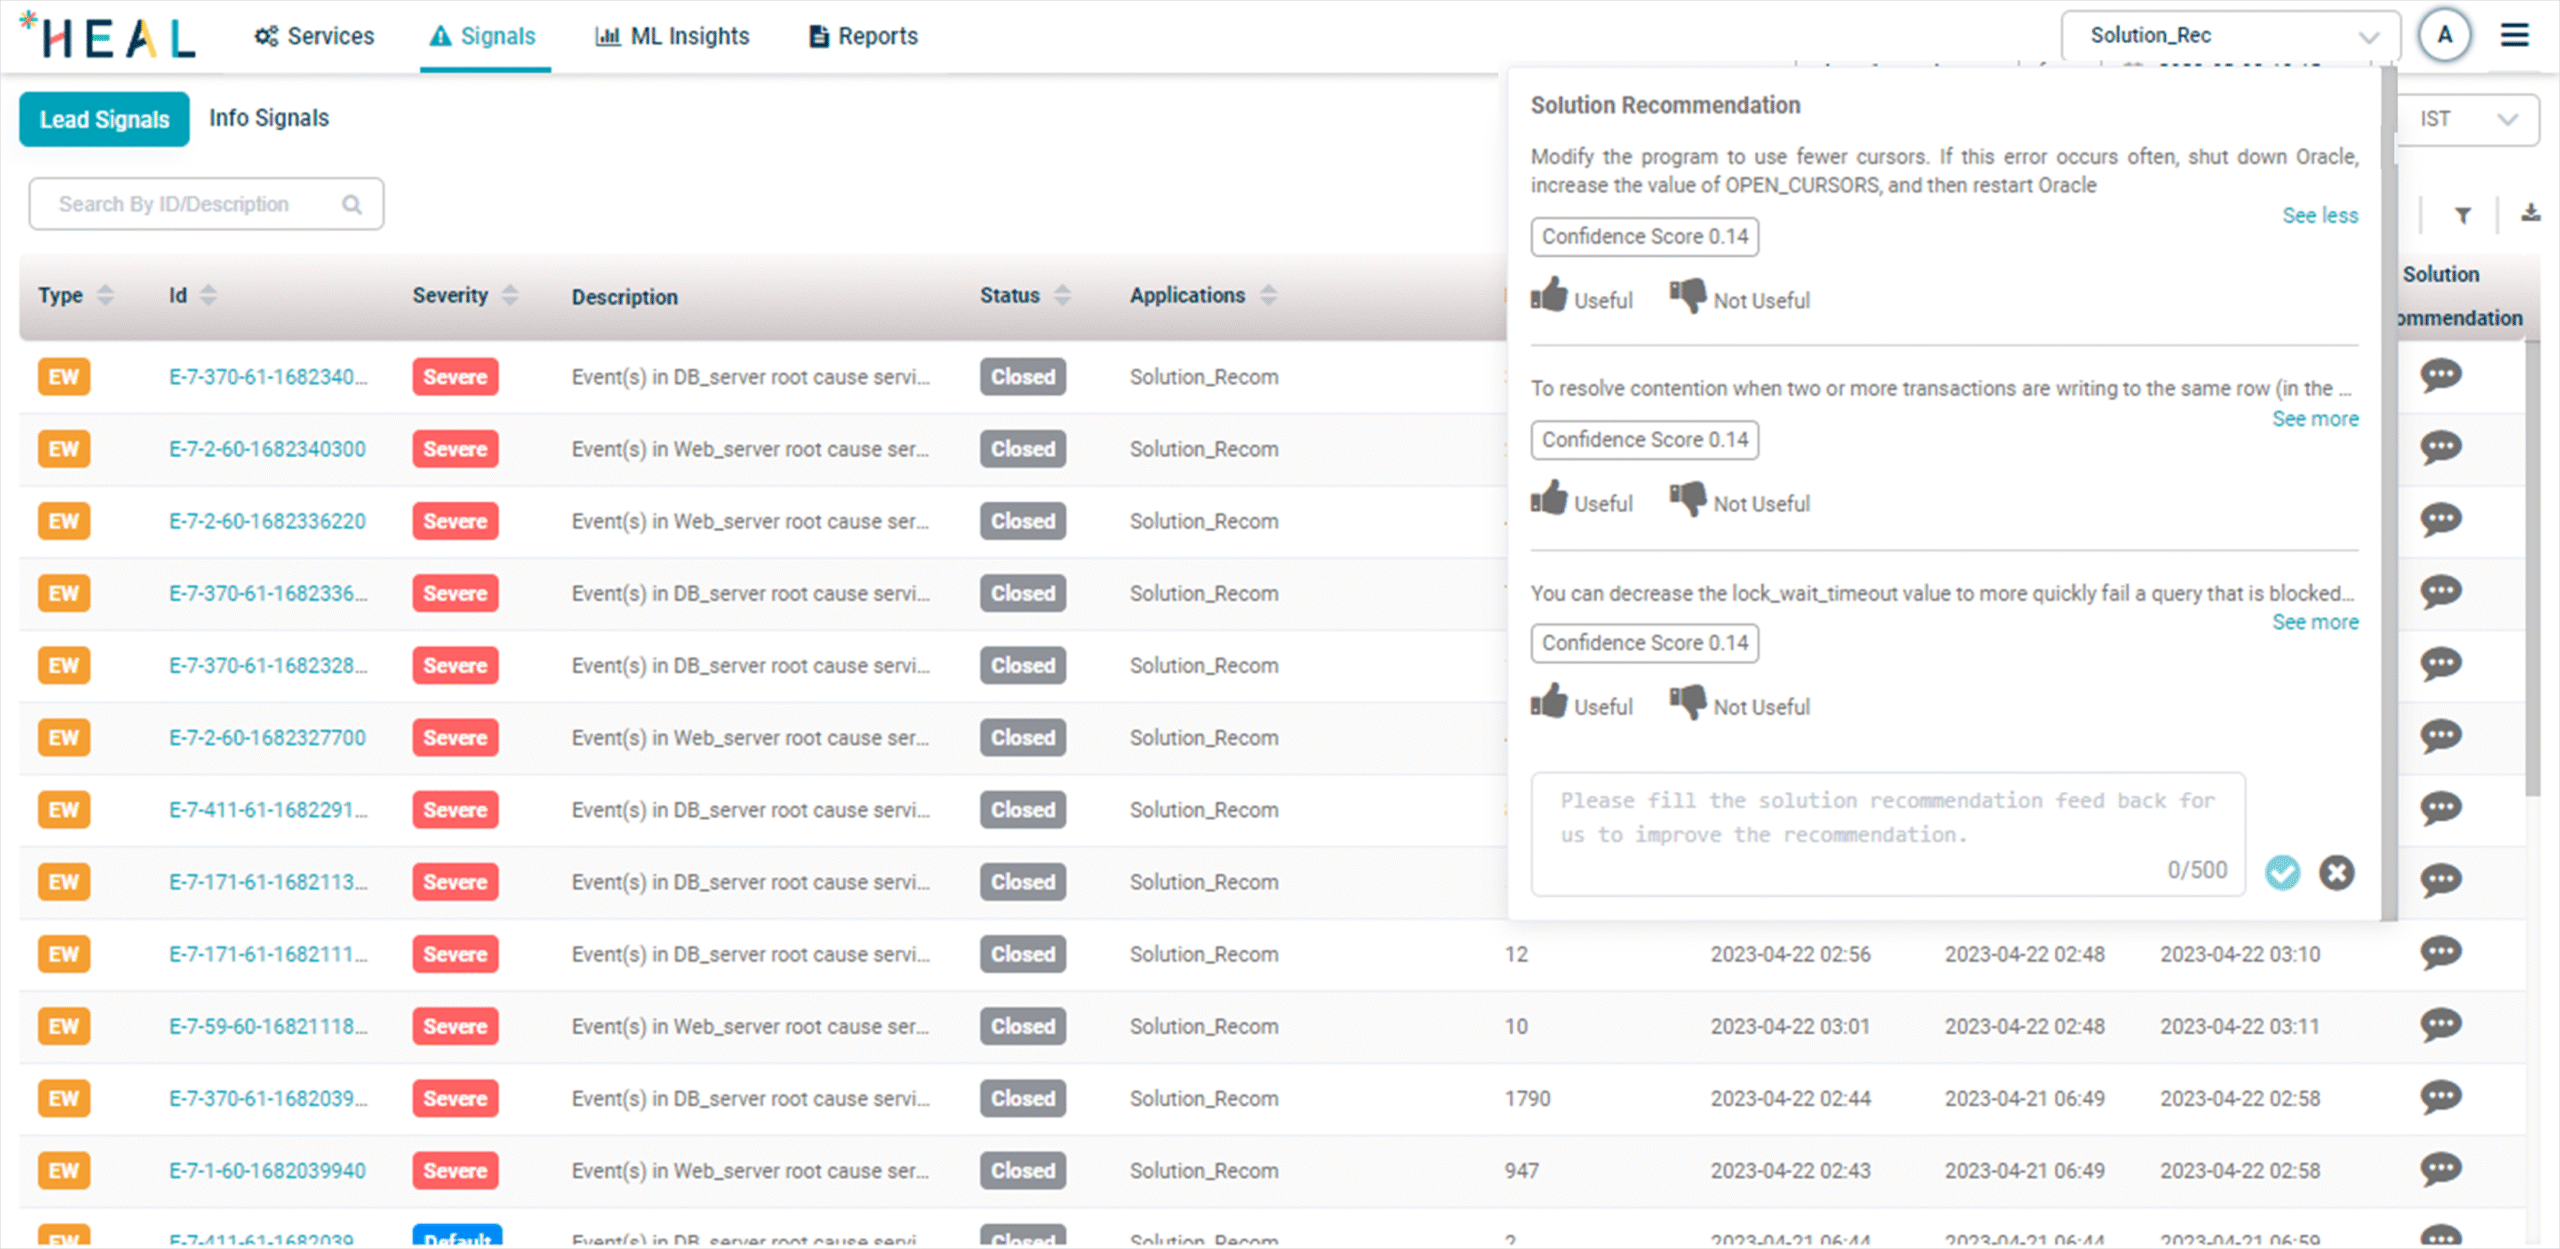
Each recommendation includes:
- Solutions. The proposed fix for the Problem or Early Warning.
- Confidence Score. How confident HEAL is in the suggestion.
- Useful or Not Useful. Thumbs up if the solution worked, thumbs down if it did not.
- Feedback. Free-text feedback to improve future recommendations.
For more on suggested solutions, see View Solution Recommendation.
Next
- View Early Warning Report . open one Early Warning.
- View Problem Report . open one Problem.
- Root Cause Analysis . see the Root Cause Walk for a signal.